


Chapter 5 Dashboard
ZyWALL 110/310/1100 Series User’s Guide
74
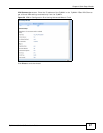
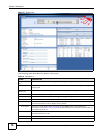
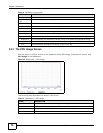
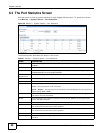
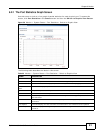
5.2.1 The CPU Usage Screen
Use this screen to look at a chart of the ZyWALL’s recent CPU usage. To access this screen, click
CPU Usage in the dashboard.
Figure 52 Dashboard > CPU Usage
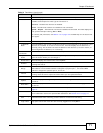
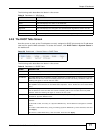
The following table describes the labels in this screen.
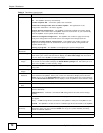
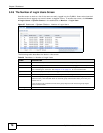
Logs This field displays whether a log (and alert) was created for the triggered firewall rule.
The Latest Alert
Logs
These fields display recent logs generated by the ZyWALL.
# This is the entry’s rank in the list of alert logs.
Time This field displays the date and time the log was created.
Priority This field displays the severity of the log.
Category This field displays the type of log generated.
Message This field displays the actual log message.
Source This field displays the source address (if any) in the packet that generated the log.
Destination This field displays the destination address (if any) in the packet that generated the log.
Protocol This field displays the service protocol in the packet that generated the log.
Note This field displays descriptive information (if any) of the log.
Table 14 Dashboard (continued)
LABEL DESCRIPTION
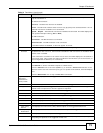
Table 15 Dashboard > CPU Usage
LABEL DESCRIPTION
The y-axis represents the percentage of CPU usage.
The x-axis shows the time period over which the CPU usage occurred
Refresh Interval Enter how often you want this window to be automatically updated.
Refresh Click this to update the information in the window right away.