


Chapter 6 Monitor
ZyWALL 110/310/1100 Series User’s Guide
81
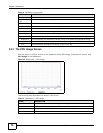
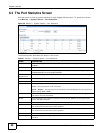
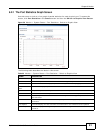
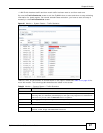
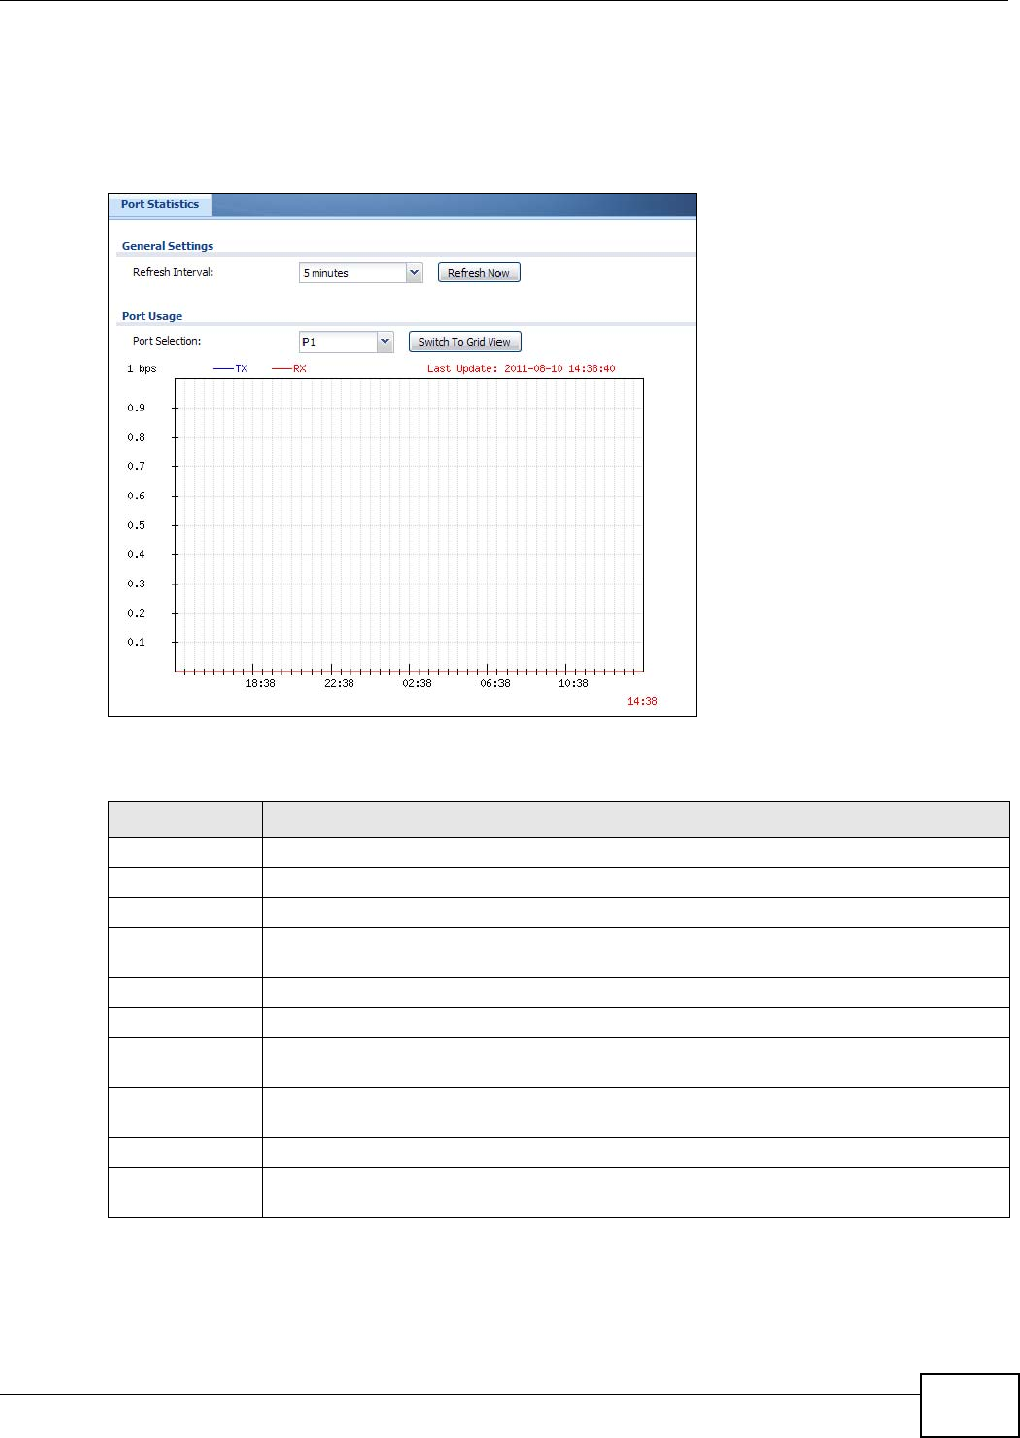
6.2.1 The Port Statistics Graph Screen
Use this screen to look at a line graph of packet statistics for each physical port. To access this
screen, click Port Statistics in the Status screen and then the Switch to Graphic View Button.
Figure 59 Monitor > System Status > Port Statistics > Switch to Graphic View
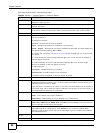
The following table describes the labels in this screen.
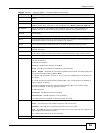
Table 22 Monitor > System Status > Port Statistics > Switch to Graphic View
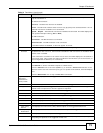
LABEL DESCRIPTION
Refresh Interval Enter how often you want this window to be automatically updated.
Refresh Now Click this to update the information in the window right away.
Port Selection Select the number of the physical port for which you want to display graphics.
Switch to Grid
View
Click this to display the port statistics as a table.
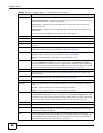
bps The y-axis represents the speed of transmission or reception.
time The x-axis shows the time period over which the transmission or reception occurred
TX This line represents traffic transmitted from the ZyWALL on the physical port since it was
last connected.
RX This line represents the traffic received by the ZyWALL on the physical port since it was last
connected.
Last Update This field displays the date and time the information in the window was last updated.
System Up Time This field displays how long the ZyWALL has been running since it last restarted or was
turned on.