


Statistics
4-2 RMON Statistics
or
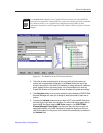
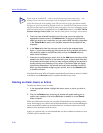
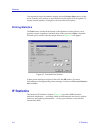
For MIB-II interface statistics, click to select I/F Statistics. The MIB-II
Interface Statistics window (Figure 4-3) will appear.
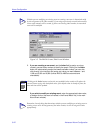
RMON Statistics
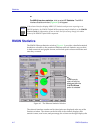
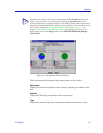
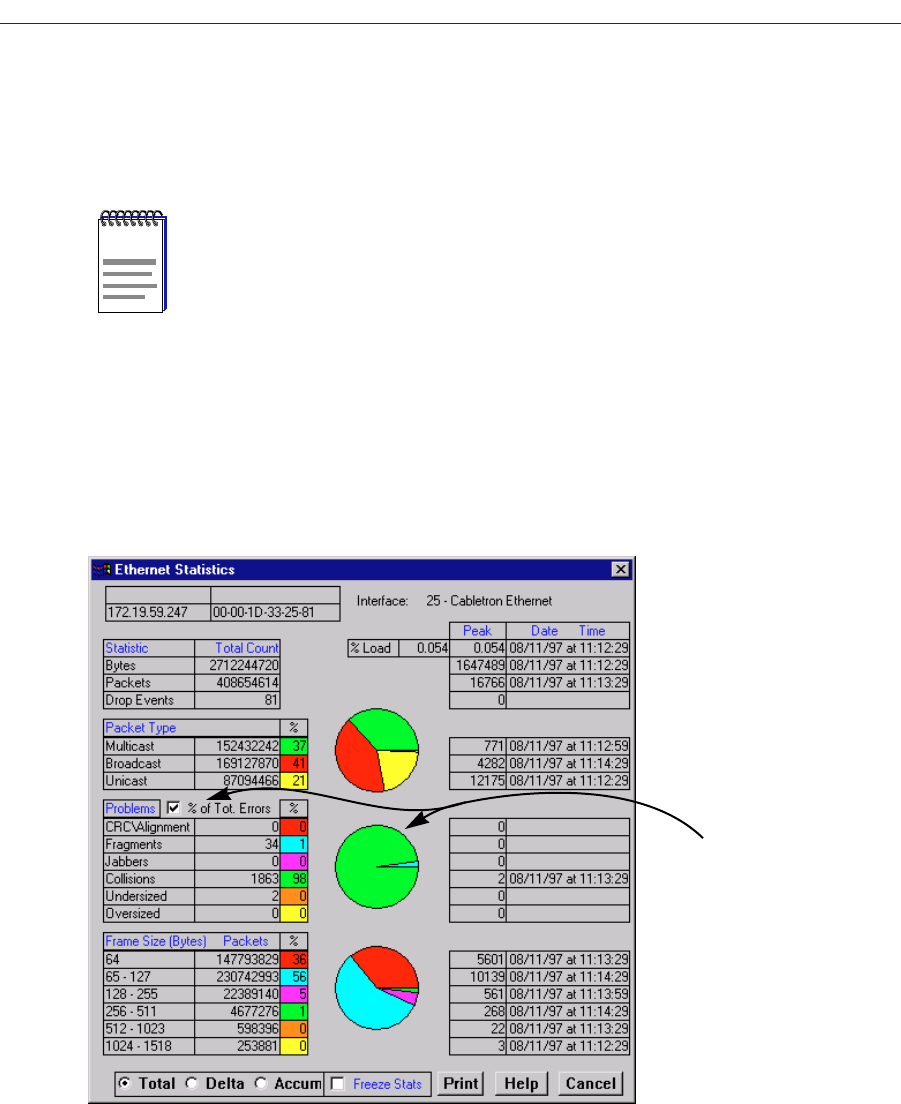
The RMON Ethernet Statistics window (Figure 4-1) provides a detailed statistical
breakdown of trafÞc on the monitored Ethernet network. Statistics are provided
in both numerical and graphic format, and include peak values and the date and
time they occurred.
Figure 4-1. The Ethernet Statistics Window
The selected interface number and its description are displayed at the top of the
Statistics window. The column on the left side of the window displays each
statisticÕs name, total count, and percentage; the column on the right displays the
NOTE
If the selected interface displays MIB-II I/F Statistics and you were expecting to see
RMON statistics, the RMON Default MIB component may be disabled; see the RMON
UserÕs Guide for information on how to check (and if necessary, change) the admin
status of the RMON Default MIB component.
The Errors pie
chart will only be
displayed when the
% of Tot. Errors
option is selected.