


Statistics Menu 106
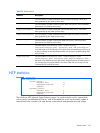
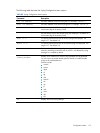
The following table describes the NTP statistics:
Table 76
NTP statistics
Statistics Description
Primary Server
• Requests Sent—The total number of NTP requests the switch
sent to the primary NTP server to synchronize time.
• Responses Received—The total number of NTP responses
received from the primary NTP server.
• Updates—The total number of times the switch updated its time
based on the NTP responses received from the primary NTP
server.
Secondary Server
• Requests Sent—The total number of NTP requests the switch
sent to the secondary NTP server to synchronize time.
• Responses Received—The total number of NTP responses
received from the secondary NTP server.
• Updates—The total number of times the switch updated its time
based on the NTP responses received from the secondary NTP
server.
Uplink Failure Detection statistics
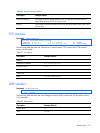
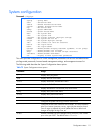
This menu option allows you to display Uplink Failure Detection (UFD) statistics. To reset UFD statistics,
follow the command /stats/ufd with the following argument: clear.
Command: /stats/ufd
Uplink Failure Detection statistics:
Number of times LtM link failure: 1
Number of times LtM link in Blocking State: 0
Number of times LtD got auto disabled: 1
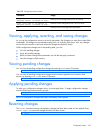
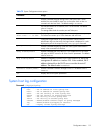
The following table describes the Uplink Failure Detection (UFD) statistics:
Table 77
Uplink Failure Detection statistics
Statistics Description
Number of times LtM link failure
The total numbers of times that link failures were
detected on the uplink ports in the Link to Monitor group.
Number of times LtM link in Blocking
State
The total number of times that Spanning Tree Blocking
state was detected on the uplink ports in the Link to
Monitor group.
Number of times LtD got auto disabled
The total numbers of times that downlink ports in the Link
to Disable group were automatically disabled because
of a failure in the Link to Monitor group.