


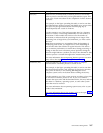

Placement of WebSphere MQ Log and Data Files
If your system has to be able to process a high message rate, you should consider
placing your WebSphere MQ log and data files on a fast SAN, preferably
configured with a large NVRAM and RAID-10. A single internal disk should have
sufficient capacity to allow up to 150K to 200K messages per second. Files on a
RAID-10 LUN should be able to get up to around 1.5M to 2.0M messages per hour.
Beyond that message rate, you may want to consider implementing multiple queue
managers with separate data and log files.
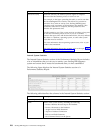
Performance Statistics
The Performance Statistics Report is the key to managing your Sterling B2B
Integrator performance.
Before you can generate or view a performance statistics report, you must turn on
performance statistics. For more information about how to turn it on, refer to the
topic Turning On and Turning Off Performance Statistics. You can turn on and turn
off performance statistics as many times as you want to. When performance
statistics is turned off, the statistics are simply discarded, and when performance
statistics is turned on, the current report resumes the process of collecting statistics.
If you do not generate a report before you turn on performance statistics, the
default report is generated automatically, and collects the performance statistics.
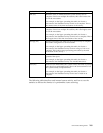
Run the Performance Statistics Report to obtain benchmarks directly after you
perform each of these tasks:
v Install Sterling B2B Integrator.
v Tune Sterling B2B Integrator using the information provided in the topic
“Manual Performance Tuning” on page 166.
v Complete manual tuning, if any, to the install_dir/properties/
noapp.properties file and related extension files (*.ext).
v Make improvements to your business processes, if necessary, including changing
the persistence levels.
After you receive your initial benchmark Performance Statistics Report, generate a
new report every few weeks or at least once a month to have a snapshot of the
way your Sterling B2B Integrator is performing in relation to your benchmarks.
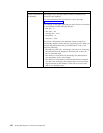
If you note variances between your benchmarks and your current report, you can
use the information in the report to troubleshoot and resolve issues before they
cause performance delays. The most current report is always at the top of the View
Report list. After you close a report, no further data can be added to the report.
Every time you generate a new report, the new report becomes the current report.
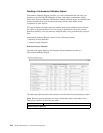
Viewing a Performance Statistics Report
To view a Performance Statistics Report:
1. From the Administration menu, select Operations > System > Performance >
Statistics.
2. In the Performance Statistics Report Manager page, under View Report, select a
name from the list, and click Go!.
Performance Management 203