


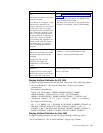

Parameter / Description Default Value
-Xss
Determines the stack size for each
thread in the JVM.
Every thread in a JVM gets a stack,
and this value determines the
number of threads you can start in
a JVM. If this value is too large,
you might run into an OOM. Each
time a method is invoked, a stack
frame is created and pushed into
the thread stack. At a minimum, a
stack frame contains a method's
local variables and arguments. If a
thread's actual stack size reaches
beyond this limit, you will get a
java.lang.StackOverflowError
exception.
Refer to “Edit Performance Configuration Settings”
on page 123 for the default values for the:
v Maximum Java stack size for any thread for the
server JVM (STATIC_STACK)
v Maximum Java stack size for any thread for the
container JVM (STATIC_STACK_CONTAINER)
-XX:CompileThreshold
Determines the number of method
invocations and branches before
compiling.
Setting a low value for this
parameter will trigger the
compilations of hot methods
sooner.
For both 32-bit/64-bit noapp and container JVMs:
v Windows = -XX:CompileThreshold=1000
v Solaris = -XX:CompileThreshold=1000
-Xnocatch
Disables the Java catch-all signal
handler. This option is used to get
clean, native code stack traces.
For both noapp and container JVMs:
HP-UX = -Xnocatch
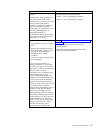
Display HotSpot Statistics for HP JVM
To display HotSpot Statistics for the HP JVM, enable one of the following options:
v -XX:+PrintGCDetails -XX:+PrintGCTimeStamps –Xloggc:<gcfilename>
-verbose:<gc>
This displays the following:
11.010: [GC [PSYoungGen: 196608K->20360K(229376K)] 196608K-
>20360K(753664K), 0.0514144 secs] 13.987: [GC [PSYoungGen:
216968K->32746K(229376K)] 216968K->48812K(753664K), 0.1052434 secs]
v -Xverbosegc [:help] | [0 | 1] [:file = [stdout | stderr | <filename>]]
This displays the following:
<GC: 1 4 11.988605 1 64 7 201326592 64 201326592 0 20850824 33554432 0 0
536870912 15563792 15563792 21757952 0.040957 0.040957 > <GC: 1 4
13.400027 2 864 7 201326592 864 201326592 20850824 33539216 33554432 0
16479936 536870912 17504224 17504224 21757952 0.088071 0.088071 >
Display HotSpot Statistics for Sun JVM
To display HotSpot Statistics for the Sun JVM, enable the following option:
-XX:+PrintGCDetails -XX:+PrintGCTimeStamp –Xloggc:<gcfilename>
Performance Management 69