


This displays the following:
0.000: [GC 0.001: [DefNew: 32192K->511K(33152K), 0.0383176 secs]
32192K->511K(101440K), 0.0385223 secs] 1.109: [GC 1.110: [DefNew:
32703K->198K(33152K), 0.0344874 secs] 32703K->697K(101440K), 0.0346844
secs]
Refer to the corresponding Sun documentation, which can be accessed from the
following Web site:
http://java.sun.com/javase/technologies/hotspot/gc/gc_tuning_6.html
HotSpot JVM Heap Monitoring
You may want to monitor the following items in a healthy heap:
v During steady state, you should mostly see minor Garbage Collections (GC)
and an occasional full GC caused by allocation failures.
v The sum of the GC times should not exceed 3 percent of the measurement
interval. For example, in a 1-hour measurement interval, the time taken for all
the GCs should not be more than 108 seconds.
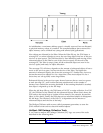
v The JVM will choose to perform a full GC when it realizes that the live objects
in the Eden and Survivor spaces cannot fit in the old generation. The JVM then
tries to free up the space in the old generation by performing a full GC. The full
GC pauses the application. The amount of pause time depends on the GC
algorithm you are using (Sterling B2B Integrator uses the default JVM GC
algorithm, that is, Parallel GC algorithm on 1.6 JDK on server class machines),
and the size of the heap. The JVM will choose to perform a full GC when it
realizes that the live objects in the Eden and Survivor spaces will not fit into the
old generation. In an attempt to free up the space in the old generation, the JVM
will perform a full GC, which pauses the application. The amount of pause time
depends on:
– Type of GC algorithm currently in use. Sterling B2B Integrator uses the
default JVM GC algorithm, that is, Parallel GC algorithm, on 1.6 JDK on
server class machines.
– Size of the heap. Too many full GCs have a negative effect on performance.
If you observe many full GCs, try to determine if your old generation is sized
too small to hold all the live objects collected from the Survivor and Eden
spaces. Alternatively, there may be too many live objects that do not fit into the
configured heap size. If it is the latter, increase the overall heap size.
v If you are monitoring the heap and notice an increase in the number of live
objects, and see that the GC is not able to clear these objects from the heap, you
might run into an Out-Of-Memory (OOM) condition, and there may be a
possible memory leak. In such a situation, take a heap dump at various intervals
and analyze the dump for the leak suspect.
HotSpot JVM Thread Monitoring
Monitoring JVM threads will help you locate thread deadlocks if there are blocked
threads in a Java code or in SQL. It also helps you to understand which part of the
code the threads are blocked in a hung application or running application.
Following is an example of a thread dump:
"Thread-817" daemon prio=10 tid=0x00b9c800 nid=0x667 in Object.wait() [0xa4d8f000..0xa4d8faf0]
at java.lang.Object.wait(Native Method)
- waiting on <0xf678a600> (a EDU.oswego.cs.dl.util.concurrent.LinkedNode)
at EDU.oswego.cs.dl.util.concurrent.SynchronousChannel.poll(SynchronousChannel.java:353)
- locked <0xf678a600> (a EDU.oswego.cs.dl.util.concurrent.LinkedNode)
at EDU.oswego.cs.dl.util.concurrent.PooledExecutor.getTask(PooledExecutor.java:707)
70 Sterling B2B Integrator: Performance Management