


A Crash, Instead of an OutOfMemoryError
In rare cases, you may have a JVM crash instead of OOM because of the allocation
from the native heap failing because the native code that does not check for errors
returns memory allocation functions. For example, this may occur if the native
code malloc returns NULL (no memory available), and if the native code is not
checking for that error, and references the invalid memory location. If the diagnosis
of this failure results in native code not checking for errors because of memory
allocation failures, the reasons for memory allocation failures should be examined.
The failures may be due to reasons such as insufficient swap space, some other
processes consuming all the memory, or a native leak.
Hung Processes or Looping Processes
Generally, the most common reasons for a hang to occur are deadlocks in
application code, API code, library code, or a bug in the HotSpot VM. However, in
a few cases, the hang might be because of a JVM consuming all the available CPU
cycles, most likely because of a bug, which in turn causes one or more threads to
go into an infinite loop.
If a hang is seen, determine whether the JVM is idle or consuming all the CPU
cycles. You can use the OS utilities to determine the CPU utilization. If you
conclude that the hang process is using the entire CPU, the hang might be because
of a looping thread. On the other hand, if the process is idle, it is most likely
because of deadlock. On Solaris, for example, prstat -L -p <pid> can be used to
report the statistics for all the LWPs in the target process. This will identify the
threads that are consuming a lot of CPU cycles.
Diagnosing a Looping Process
If your observations on CPU utilization indicate that the process is looping, take a
thread dump, and from the thread dump and stack trace, you should be able to
gather information about where and why the thread is looping.
In the thread dump, look for the runnable threads. You will in all probability find
the threads that are looping. In order to be certain about the threads that are
looping, take multiple thread dumps to see if the thread remains busy.
Diagnosing a Hung Process
If you have determined that a process is hanging, and not looping, the cause is
likely to be an application (thread) deadlock.
Take a thread dump and analyze it to find the deadlocked threads.
When you take a thread dump on a HotSpot JVM, the deadlock detection
algorithm is also executed and the deadlock information in the thread dump
printed.
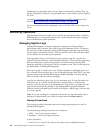
Following is an example of some deadlock output from a document. For more
information, refer to the Java Troubleshooting and Diagnostic Guide.
Found one Java-level deadlock:
=============================
"AWT-EventQueue-0": waiting to lock monitor 0x000ffbf8 (object 0xf0c30560, a
java.awt.Component$AWTTreeLock),
which is held by "main"
"main":
Performance Management 75