


<af type="tenured" id="100" timestamp="Sun Nov 25 15:56:09 2007"
intervalms="120245.593">
<minimum requested_bytes="10016" />
<time exclusiveaccessms="0.045" />
<tenured freebytes="2704" totalbytes="1073741824" percent="0" >
<soa freebytes="2704" totalbytes="1073741824" percent="0" />
<loa freebytes="0" totalbytes="0" percent="0" />
</tenured>
<gc type="global" id="100" totalid="100" intervalms="120245.689">
<refs_cleared soft="0" threshold="32" weak="0" phantom="0" />
<finalization objectsqueued="0" />
<timesms mark="35.301" sweep="5.074" compact="0.000" total="40.426" />
<tenured freebytes="808526296" totalbytes="1073741824" percent="75" >
<soa freebytes="808526296" totalbytes="1073741824" percent="75" />
<loa freebytes="0" totalbytes="0" percent="0" />
</tenured>
</gc>
<tenured freebytes="808516280" totalbytes="1073741824" percent="75" >
<soa freebytes="808516280" totalbytes="1073741824" percent="75" />
<loa freebytes="0" totalbytes="0" percent="0" />
</tenured>
<time totalms="40.569" />
</af>
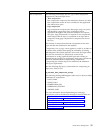
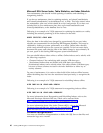
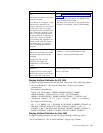
In this example, <af type=”tenured” id=”100” indicates that this is the 100th time
an attempt to allocate memory has failed, and as a result, a GC was initiated. An
allocation failure is not an error in the system or code. When enough free space is
not available in the heap, the JVM automatically initiates a garbage collection. The
last time an allocation failure occurred was 120245.593 milliseconds ago (or 120.245
seconds).
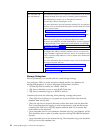
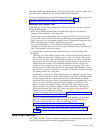
The lines starting with <gc type=”global” id=”100” provide information about the
collection process. In this example, garbage collection initiated the mark phase and
the sweep phase, which were completed in 35.301 and 5.074 milliseconds
respectively. The JVM determined that the heap was not fragmented, and that
compacting the heap was not required. At the end of the GC, the heap had
808,516,280 bytes of available memory.
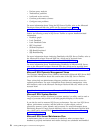
It is important that the frequency of GCs be monitored. This can easily be achieved
by looking at the time between the allocation failures. Typically, a healthy JVM will
spend less than 0.5 seconds in each GC cycle. Also, the overall percentage of time
spent on garbage collection should be less than 3 percent. To calculate the percent
of time spent performing garbage collection, divide the sum of the garbage
collection time over a fixed interval by the fixed interval.
IBM provides documentation pertaining to its Garbage Collector and how to
interpret its GC statistics.
Refer to either the IBM JDK 6.0: Java Diagnostics Guide or the IBM DeveloperWorks
article "Fine-tuning Java garbage collection performance", which is available at the
following Web site:
http://www.ibm.com/developerworks/ibm/library/i-gctroub/
Introduction to HotSpot JVM Performance and Tuning
The Sun HotSpot JVM is used when you deploy Sterling B2B Integrator on a Sun
Solaris operating system running on Sun UltraSPARC processor-based servers and
on a Windows operating system.
Performance Management 63