


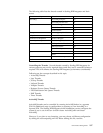
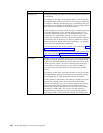

Statistic Name Description
Name Name of a business process, followed by numbered rows
pertaining in the individual activities in the business process. The
number of each row indicates the corresponding step in the
business process.
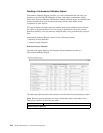
For example, in the preceding figure, the business process
CIIDeenveloper includes two activities:
v --> 1 DeenveloperCII
v --> 2 DecisionEngineService
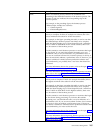
Min (ms) Minimum time (in milliseconds) it took for a business process or
activity to complete. If there are multiple invocations, this is the
lowest minimum time taken for all the invocations.
For example, in the figure preceding this table, it can be seen that
the CIIDeenvelope business process took 19183 ms to complete,
while the Deenveloping step (1 DeenveloperCII) took a minimum
time of 18474 ms. Both these are the lowest statistics; there were
two invocations of the business process.
Use this statistic to track business processes or activities that begin
to slow down. If you notice this statistic increasing over your
benchmark value, it may be indicative of a performance issue. If
you see an occasional variance for a business process or activity, it
does not necessarily indicate a performance issue. If, however, you
notice a continuous variance between production statistics and
your benchmarks, you probably have a real issue that should be
addressed.
For more information about slow systems, refer to the topic A Slow
System: Symptoms, Causes, and Resolution.
For more information about improving business process execution
time, refer to the topic Symptoms and Causes of Poor Business
Process Execution Time.
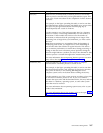
Max (ms) Maximum time (in milliseconds) it took for a business process or
activity took to complete. If there are multiple invocations, this is
the highest maximum time taken for all the invocations.
For example, in the figure preceding this table, it can be seen that
the CIIDeenvelope business process took 19275 ms to complete,
while the Deenveloping step (1 DeenveloperCII) took a maximum
time of 18672 ms. Both these are the highest statistics; there were
two invocations of the business process.
Use this statistic to track business processes or activities that begin
to slow down during processing. If you notice this statistic
increasing over your benchmark value, it may be indicative of a
performance issue. If you see an occasional variance for a business
or activity, it does not indicate a performance issue. If, however,
you notice a continuous variance between production statistics and
your benchmarks, you must resolve the issue.
For more information about slow systems, refer to the topic A Slow
System: Symptoms, Causes, and Resolution.
For more information about improving business process execution
time, refer to the topic Symptoms and Causes of Poor Business
Process Execution Time.
Performance Management 205