


The thread dump can also be found on the host machine in the
install_dir/noapp/bin directory. After the download is complete, close the Dumps
download pop-up window.
To trigger a thread dump for the container JVM:
1. Change your working directory to install_dir.
2. In the command line, enter ps -ef | grep <container_name>.
This lists the container Java process id.
3. Enter kill -3 <pid>.
The thread dump is placed in the install_dir/noapp/bin directory for your
analysis.
Because thread dumps are created in a text format, they do not require any
software to make them human readable. A thread dump is broken into sections.
Following is a brief description of each thread dump tag:
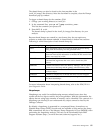
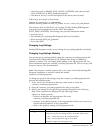
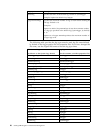
Thread Dump Tag Description
TITLE Basic information about the event that caused the thread dump,
along with the timestamp and the generated name.
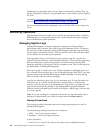
GPINFO Contains general information about the operating system. General
Protection Fault (GPF) information is included in this section if the
failure was caused by a GPF.
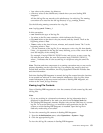
ENVINFO Contains the JRE level and details about the environment and
command-line arguments that were used to launch the JVM
process.
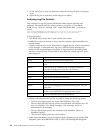
MEMINFO Contains information about the Memory Manager, and free space,
current size of the heap and the garbage collection history data.
LOCKS Contains information about the locks and monitors being held by
each Java object.
THREADS Contains a complete list of threads that have not been stopped.
CLASSES Contains the class loader summaries, including the class loaders
and their relationships.
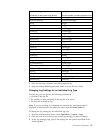
For more information about interpreting thread dump, refer to the IBM JDK 6.0:
Java Diagnostics Guide.
Heapdumps
Heapdumps are useful for troubleshooting memory-related issues since they
contain all the live objects used by the Java application. With this information, the
objects that are using large amounts of memory can be identified. The contents of a
heapdump can also help a user understand why objects cannot be freed by the
Garbage Collector.
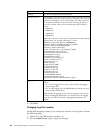
By default, a heapdump is generated in a compressed binary format know as
Portable Heap Dump (PHD). Several tools are available to help analyze the dump.
IBM recommends the use of the Memory Dump Diagnostic for Java (MDD4J) when
performing the heapdump analysis. This tool can be downloaded from IBM
Support Assistant (http://www-01.ibm.com/software/support/isa/).
Performance Management 81