


When you compile a Java source, you get an intermediate Java file called the Java
class. The class file is made up of bytecodes representing abstract instruction codes.
These codes are not directly executable by any computer processor.
To run a Java program, you start a JVM and pass the class file to the JVM. The
JVM provides many services, including loading the class file and interpreting
(executing) the byte codes. The JVM is the core technology that provides the
runtime environment in which a Java application runs.
Each Java program or application runs in its own JVM. For example, if you
configured an application server cluster with ten managed server instances that are
controlled by one administrative instance, your configuration runs 11 JVM
processes.
Since JVM is the underlying processing engine, it is critical that the JVMs are
optimally configured and are running efficiently. Incorrect JVM settings may lead
to poor application performance or JVM outages.
Run the following command to find out the JVM version installed in your system:
$JAVA_HOME/bin/java -version
Note: If your environment handles large concurrent communications traffic, it is
recommended to increase the value of the gmm.maxAllocation property in the
perimeter.properties file, along with increasing the maximum heap size of your
JVM. In such a scenario, set gmm.maxAllocation to a value greater than 384 MB. For
more information about the gmm.maxAllocation property, refer to the inline
comments in the perimeter.properties file.
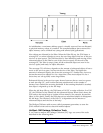
Garbage Collection Statistics
Garbage Collection (GC) statistics provide heap-related information such as:
v What are the sizes of the different heaps?
v How full is each section of heap?
v How fast is the heap getting full?
v What is the overall overhead of GC to clean the non-live objects?
Collecting and analyzing GC statistics help size the different sections of a heap
correctly. It is recommended that you continuously collect garbage collection
statistics for all the JVMs, even in production. The collection overhead is minor
compared to the benefit. With these statistics, you can tell if:
v The JVM has or is about to run into a memory leak
v Garbage collection is efficient
v Your JVM heap settings are optimal
JVM Verbose Garbage Collection
JVM Verbose garbage collection (GC) statistics are critical and must always be
enabled in production environments. These statistics can be used to understand the
behavior of the JVM heap management and the efficiency of the JVM.
IBM JVM Garbage Collection Example
Following is an example of the GC output for JVM:
62 Sterling B2B Integrator: Performance Management