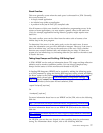
at Deadlock$DeadlockMakerThread.run(Deadlock.java:32)
- waiting to lock <0xf819a938> (a java.lang.String)
- locked <0xf819a970> (a java.lang.String)
"Thread1":
at Deadlock$DeadlockMakerThread.run(Deadlock.java:32)
- waiting to lock <0xf819a970> (a java.lang.String)
- locked <0xf819a938> (a java.lang.String)
Found 1 deadlock.
If the Java VM flag -XX:+PrintConcurrentLocks is set, Ctrl+Break will also print
the list of concurrent locks owned by each thread.
HotSpot JVM Blocked Thread Detection
Look for threads that are blocked. Threads might be waiting on SQL or might be
serialized on a synchronized block. If you see threads that are blocked they are
waiting on another thread to complete, it means that you are serializing on some
part of code.
HotSpot JVM Troubleshooting Tips
Java.lang.OutOfMemory errors occur when either the Java heap or the native heap
run out of space. These exceptions may indicate that the number of live objects in
the JVM require more memory than what is available (which can be adjusted by
tuning the heap), or that there is a memory leak (which may indicate a problem
with an application component, the JVM, or the OS). There are many variants of
this error, with each variant having its own cause and resolution.
Generally, java.lang.OutOfMemory (OOM) indicates that insufficient space has
been allocated for a requested object in the heap, or in a particular area of the
heap, even after a garbage collection is attempted. An OutOfMemory exception
does not always indicate a memory leak. It could indicate that the heap parameters
are not configured properly for an application or that the bug is complex, with you
having to troubleshoot different layers of native code.
When an OOM error is from the native code, it is difficult to tell whether it is from
Java heap exhaustion or native heap exhaustion because of low space. The first
step in diagnosing an OOM is identifying whether the Java heap is full or the
native heap is full.
Exception in thread “main” java.lang.OutOfMemoryError
This error condition might be due to a simple configuration issue. It might be that
the –Xms value configured for this type of application is throwing the error. This
error generally occurs when object allocation fails even after a Garbage Collection
(GC).
This error condition may be because of a memory leak, in which case, the object
references are held by the application even if they are no longer needed. Over a
period of time, this unintentional object growth increases and causes this OOM.
This type of OOM error can also be seen in applications in which excessive
finalizer calls are made. In such applications, where the finalizer call is made, the
GCs cannot reclaim the object space. Instead, they are queued for finalization to
occur, which might happen some time later. In a Sun implementation, the finalizer
call is made by a separate daemon thread. If there are excessive finalize calls, the
finalization thread cannot keep up with the load, and eventually, the heap might
become full and an OOM might occur. For example, applications that create
high-priority threads that cause the finalization to increase at a rate that is faster
Performance Management 73


