


Procedure
1. From the Administration menu, select Operations > System > Performance >
JVM Monitor.
2. In the JVM MONITOR page, under Thread Dump, next to Take Thread Dump,
click Go!. The Thread Dump pop-up window is displayed.
3. To see the latest Dumps in the View Dumps list, click Go! in the Thread Dump
pop-up window.
4. Close the Thread Dump pop-up window.
5. Under View Dumps, select the Name of the thread dump file and click Go! to
view it. The Download Dumps pop-up window is displayed.
6. Click the Dumps download link.
7. Open or save the file.
8. Close the Download Dumps pop-up window.
What to do next
For Windows, if you have started Sterling B2B Integrator as a Windows service,
use the stacktrace tool to take a thread dump. Follow the same procedure to
perform a thread dump for container JVMs.
For more information, refer to the following Web site: http://www.adaptj.com/
main/stacktrace.
You can use VisualVM in remote mode to take a thread dump on Windows when
you start Sterling B2B Integrator noapp or container in service mode.
Refer to the corresponding VisualVM documentation for information about remote
monitoring of JVM, which is available in the following Web site:
https://visualvm.dev.java.net/
HotSpot Thread Dump Analysis Tools
Following is a list of tools that can be used to analyze thread dumps:
v Thread Dump Analyzer (TDA): (Refer to https://tda.dev.java.net/)
Note: In order to use TDA, you must strip off any starting “< “ symbols in the
thread dump if you are using Sterling B2B Integrator UI to take thread dumps.
v You can also use VisualVM for live monitoring of threads in JVM. (Refer to
https://visualvm.dev.java.net/)
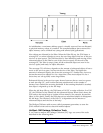
HotSpot JVM DeadLock Detection
In addition to the thread stacks, the Ctrl+Break handler executes a deadlock
detection algorithm. If any deadlocks are detected, it prints additional information
after the thread dump on each deadlocked thread.
Found one Java-level deadlock:
=============================
"Thread2":
waiting to lock monitor 0x000af330 (object 0xf819a938, a java.lang.String),
which is held by "Thread1"
"Thread1":
waiting to lock monitor 0x000af398 (object 0xf819a970, a java.lang.String),
which is held by "Thread2"
Java stack information for the threads listed above:
===================================================
"Thread2":
72 Sterling B2B Integrator: Performance Management