


77
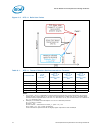
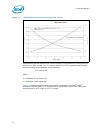
1U Thermal Solution
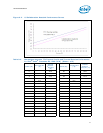
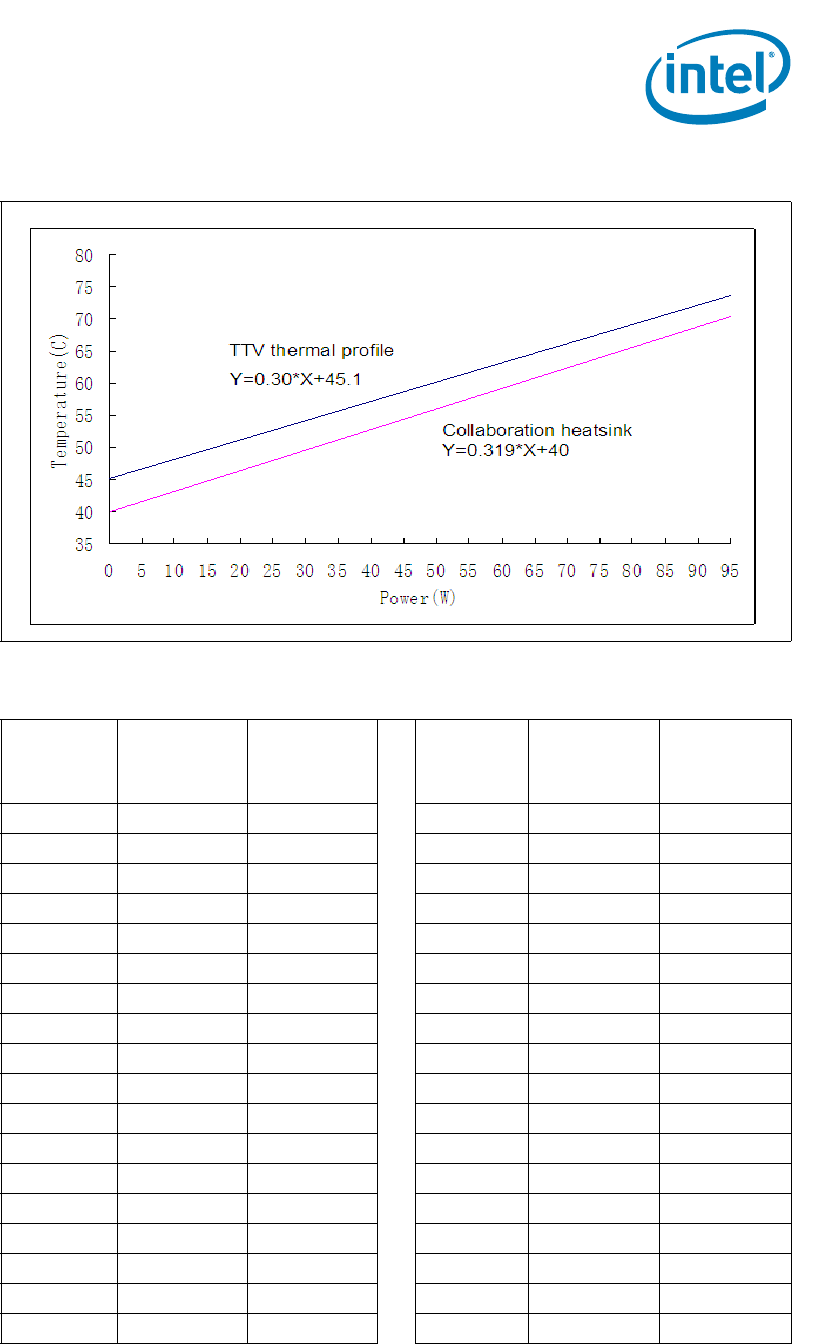
Figure 9-2. 1U Collaboration Heatsink Performance Curves
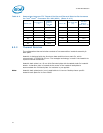
Table 9-2. Comparison between TTV Thermal Profile and Thermal Solution Performance
for Intel
®
Xeon
®
Processor E3-1280 (95W) (Sheet 1 of 2)
Power (W)
TTV T
CASE_MAX
(°C)
Thermal
Solution
T
CASE_MAX
(°C)
Power (W)
TTV T
CASE_MAX
(°C)
Thermal
Solution
T
CASE_MAX
(°C)
0
45.1
40.0 50
60.1
56.0
2
45.7
40.6 52
60.7
56.6
4
46.3
41.3 54
61.3
57.2
6
46.9
41.9 56
61.9
57.9
8
47.5
42.6 58
62.5
58.5
10
48.1
43.2 60
63.1
59.1
12
48.7
43.8 62
63.7
59.8
14
49.3
44.5 64
64.3
60.4
16
49.9
45.1 66
64.9
61.1
18
50.5
45.7 68
65.5
61.7
20
51.1
46.4 70
66.1
62.3
22
51.7
47.0 72
66.7
63.0
24
52.3
47.7 74
67.3
63.6
26
52.9
48.3 76
67.9
64.2
28
53.5
48.9 78
68.5
64.9
30
54.1
49.6 80
69.1
65.5
32
54.7
50.2 82
69.7
66.2
34
55.3
50.8 84
70.3
66.8