


............................................................................................................................................................................................................................................................
Server Statistics PanelServer Statistics
17-8
365-360-001R6.0
Issue 1, December 2008
............................................................................................................................................................................................................................................................
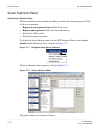
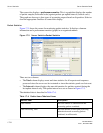
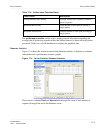
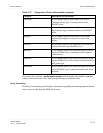
The screen also displays a performance monitor. This is a graph that displays the number
of packet samples (horizontal scale) against packets per update interval (vertical scale).
The graph can show up to four types of accounting request based on disposition. Select or
clear the appropriate checkbox to control this display.
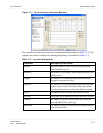
Packet Statistics
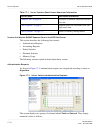
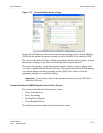
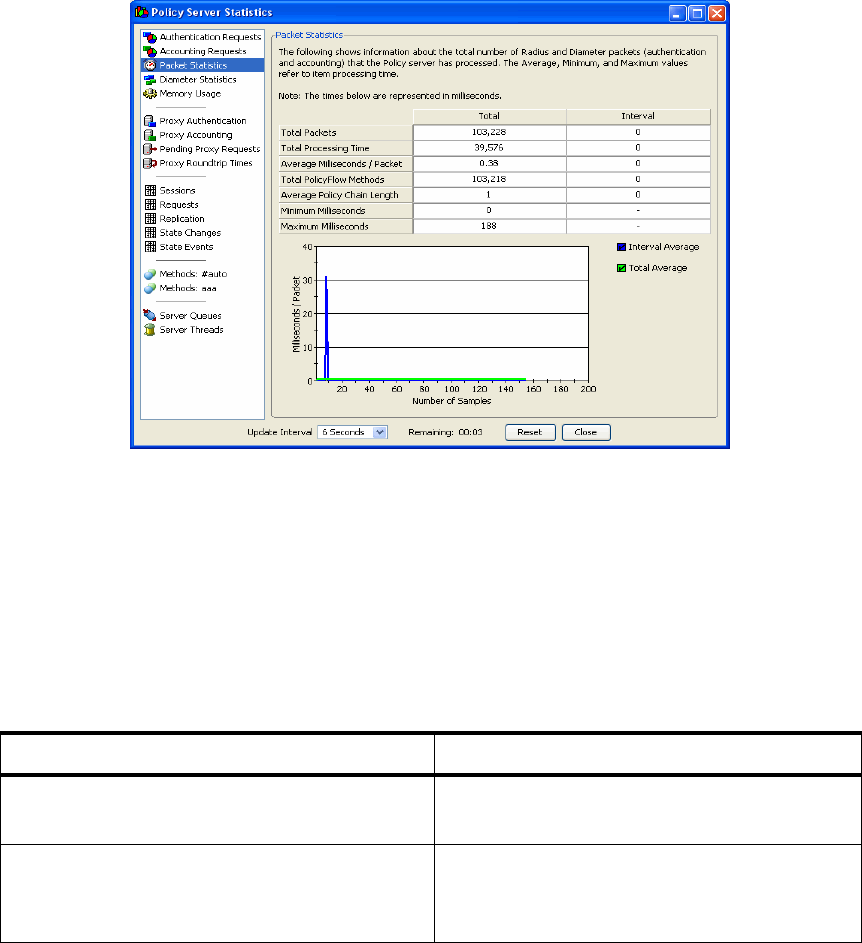
Figure 17-5 shows the screen for monitoring packet statistics. It displays columnar
information and a performance monitor (graph) in an organized manner.
Figure 17-5 Server Statistics–Packet Statistics
There are two columns:
• The Total column displays count and time statistics for all requests and responses
processed since the server was last restarted or since the statistics panel was last reset.
• The Interval column displays the same information for packets received during the
last update interval only. The update interval was set as shown in Figure 17-5.
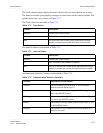
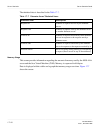
The tabulated data is described in Table 17-6.
Table 17-6 Radius Items–Tabulated Items
RADIUS Item Description
Total Packets The total number of authentication and
accounting packets combined.
Total Processing Time The total amount of time spent processing
authentication and accounting packets
combined, in milliseconds.