


Server Statistics PanelServer Statistics
............................................................................................................................................................................................................................................................
365-360-001R6.0
Issue 1, December 2008
17-9
............................................................................................................................................................................................................................................................
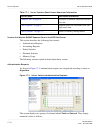
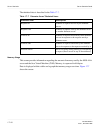
The performance monitor can be used to display current information regarding the
average rate of processing a packet within the defined interval or based on total packets
processed. Select one or both checkboxes to display the graphical data.
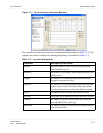
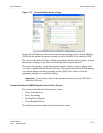
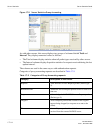
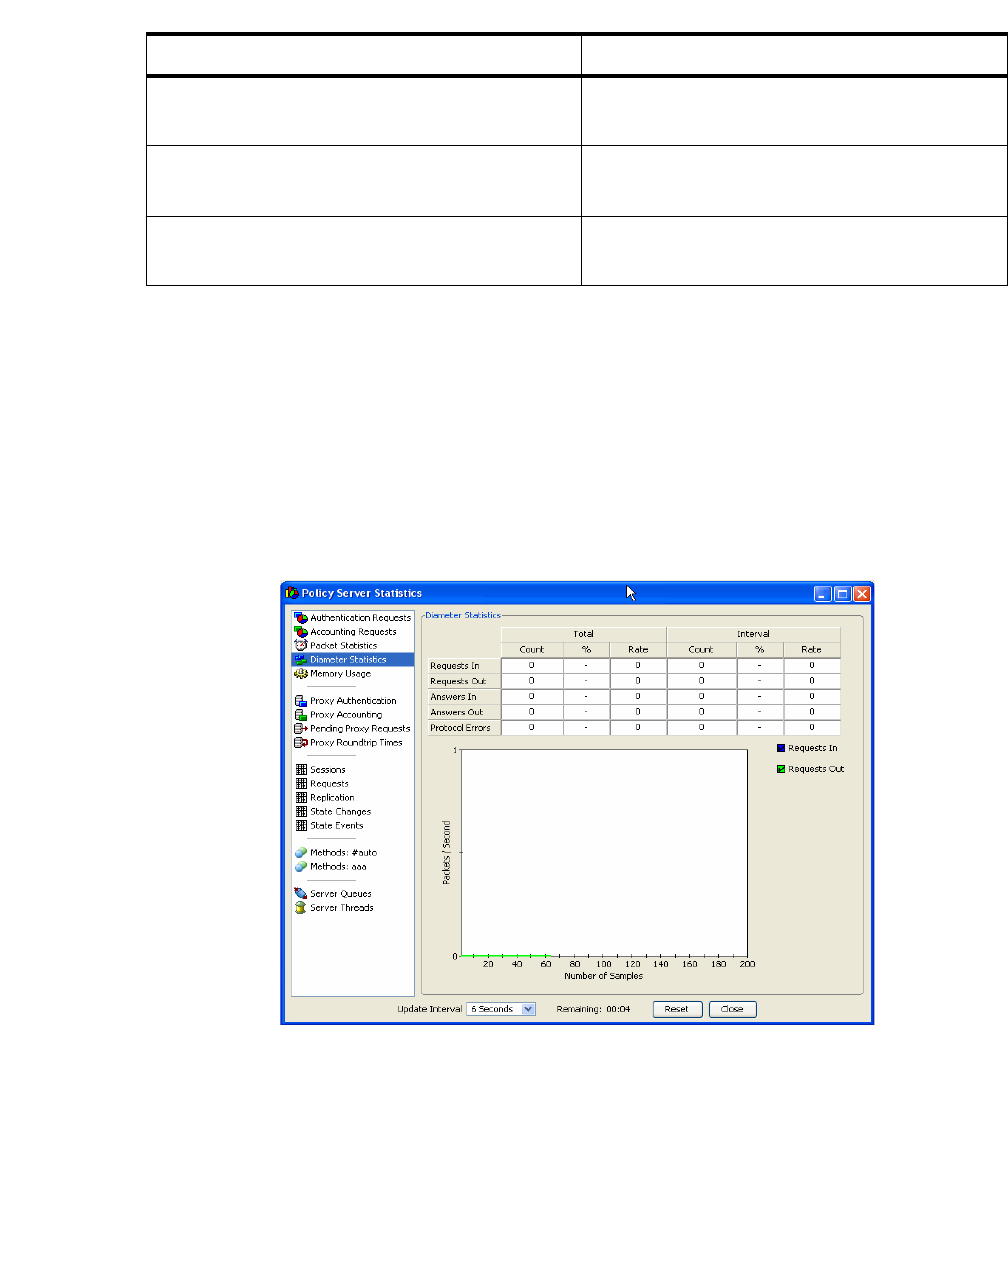
Diameter Statistics
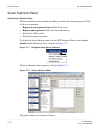
Figure 17-6 shows the screen for monitoring diameter statistics. It displays a columnar
information and a performance monitor (graph).
Figure 17-6 Server Statistics–Diameter Statistics
There are two columns Total and Interval which keeps the count of total number of
requests flowing from and to the diameter server.
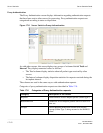
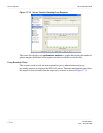
Average Milliseconds / Packet Average (Mean) rate of amount of taken to
process a packet.
Minimum Milliseconds Least amount of time spent processing a
single packet.
Maximum Milliseconds Greatest amount of time spent processing a
single packet.
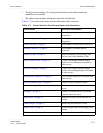
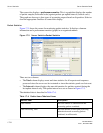
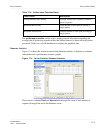
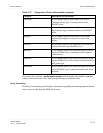
Table 17-6 Radius Items–Tabulated Items
RADIUS Item Description