


20060301
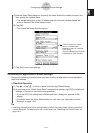
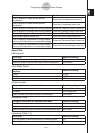
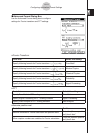
To do this: Do this:
Turn on display of Graph window pointer
coordinates
Select the [Coordinates] check box.*
Turn off display of Graph window pointer
coordinates
Clear the [Coordinates] check box.
Turn on display of leading cursor during graphing Select the [Leading Cursor] check box.
Turn off display of leading cursor during graphing Clear the [Leading Cursor] check box.*
Draw multiple graphs simultaneously Select the [Simul Graph] check box.
Draw multiple graphs one-by-one Clear the [Simul Graph] check box.*
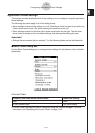
Turn on display of coordinates of Graph window
pointer and its derivative on number table display
Select the [Derivative/Slope] check box.
Turn off display of coordinates of Graph window
pointer and its derivative on number table display
Clear the [Derivative/Slope] check box.*
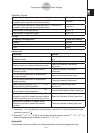
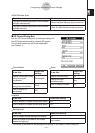
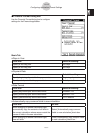
Special Tab
S
Background
To do this: Select this setting:
Turn off Graph window background display Off*
Select an image to be used as Graph window background <pict name>
S
Cell Width Pattern
To specify this row width for stat editor and data table
displays:
Select this setting:
2 cells 2 Cells
3 cells 3 Cells*
4 cells 4 Cells
S
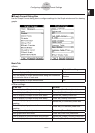
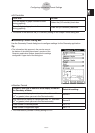
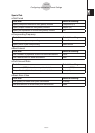
Table Variable
To specify this source for table data: Select this setting:
Table input Table input*
List data list1 through list6
Select list data to be used as source for table data <list name>
S
Summary Table
To specify this source for summary table data: Select this setting:
View Window View Window*
List data list1 through list6
Select list data to be used as source for summary table data <list name>
S
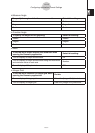
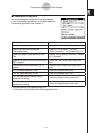
Summary Table
f
’’(
x
)
To do this: Select this setting:
Turn on display of second derivative for summary tables On*
Turn off display of second derivative for summary tables Off
1-9-7
Configuring Application Format Settings