20060301
Graphing a Recursion
An expression can be graphed as a connect type graph (G-Connect) or a plot type graph
(G-Plot).
Example: To graph
a
n
+
1
= 2
a
n
+1,
a
1
= 1
S\
ClassPad Operation
(1) Start up the Sequence Editor.
• If you have another application running, tap
/
and then
.
• If you have the Sequence application running, tap
and then [Sequence Editor].
(2) Tap the [Recursive] tab.
(3) Specify the recursion type by tapping [Type] and then [
a
n
+
1
Type
a
1
].
(4) Input the recursion expression.
• Tap the input box to the right of
a
n
+
1
:, and then use the procedures under “6-2
Inputting an Expression in the Sequence Application” to input the following.
[
n
,
a
n
] [
a
n
]
(5) Input the initial value.
(6) Tap
and then [View Window].
• This displays a dialog box for configuring View Window settings.
6-3-3
Recursive and Explicit Form of a Sequence
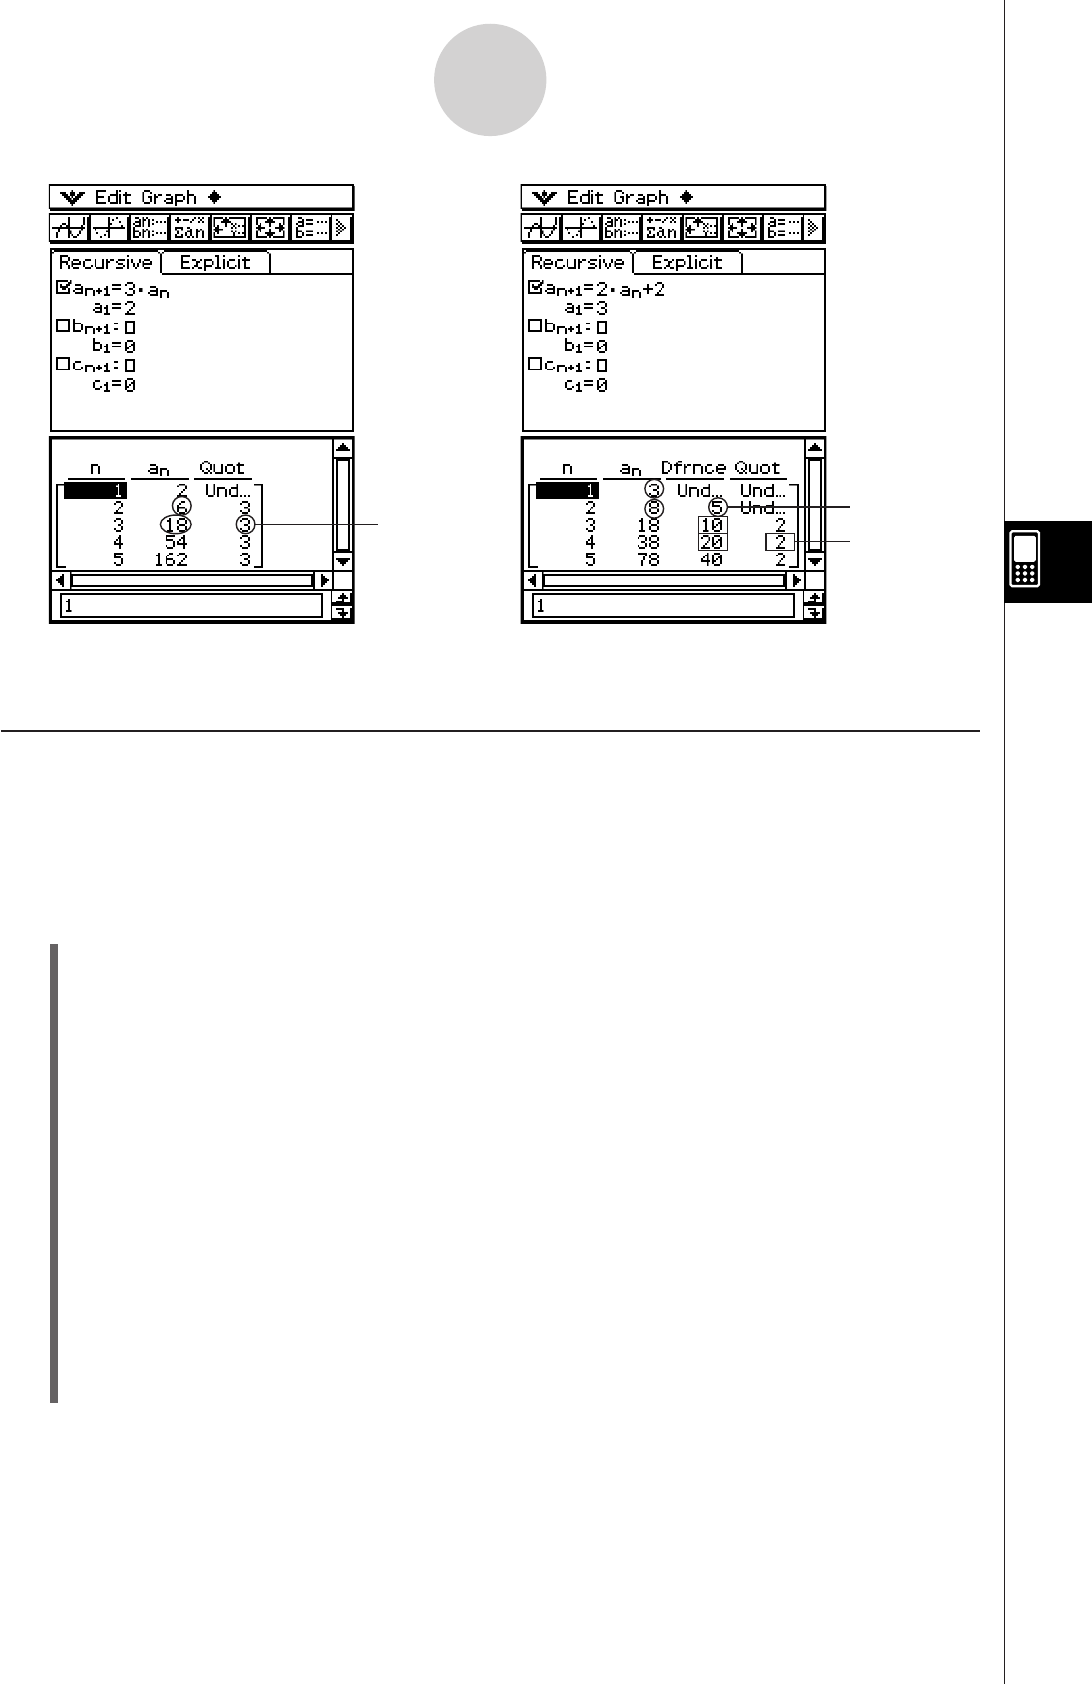
Geometric Sequence Table
Progression of Difference
Table
3 = 18
÷
6
5 = 8 – 3
2 = 20
÷
10


