


20060301
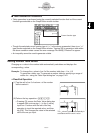
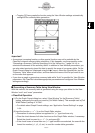
• Tapping
here graphs the function using the View Window settings automatically
configured for summary table generation.
3-4-12
Using Table & Graph
Important!
• A monotone increasing function or other special function may not be solvable by the
ClassPad’s internal summary table calculation. If this happens, use the procedure under
“Generating a Summary Table by Specifying All of the Values for
x
” (page 3-4-14) to
calculate the elements of the summary table. In addition to View Window parameters, you
can also select previously stored list data to specify the range of a summary table. On the
Graph Format dialog box (displayed using the
menu), select the [Special] tab, tap the
“Summary Table” down arrow button, and then select the name of the list you want to use
on the menu that appears.
• If you draw a graph or generate a summary table while “Auto” is specified for View Window
parameters, the ClassPad calculates appropriate parameters and configures View Window
settings accordingly.
I
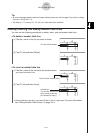
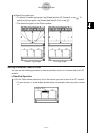
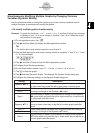
Generating a Summary Table Using View Window
With this method, the summary table is generated using the range you define for the View
Window “xmin” and “xmax” parameters.
S\
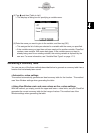
ClassPad Operation
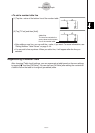
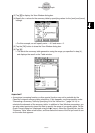
(1) On the Graph Format dialog box, select “View Window” for the [Summary Table]
setting, and specify the value you want for [Cell Width Pattern]. This example uses a [Cell
Width Pattern] setting of “4 Cells”.
• For details about Graph Format settings, see “Application Format Settings” on page
1-9-4.
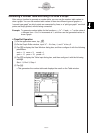
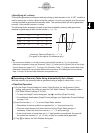
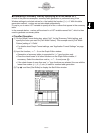
(2) Input the function
y
=
x
3
– 3
x
on the Graph Editor window.
• Generation of summary tables is supported for “
y
=” type functions only.
• Clear the check boxes of all other functions on the Graph Editor window, if necessary.
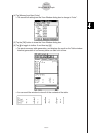
Select the check box next to
y
=
x
3
– 3
x
and press
.
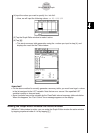
• If the check boxes of more than one “
y
=” type functions are selected, the one with the
lowest line number (
y
1,
y
2,
y
3, etc.) is used for number table generation.