20060301
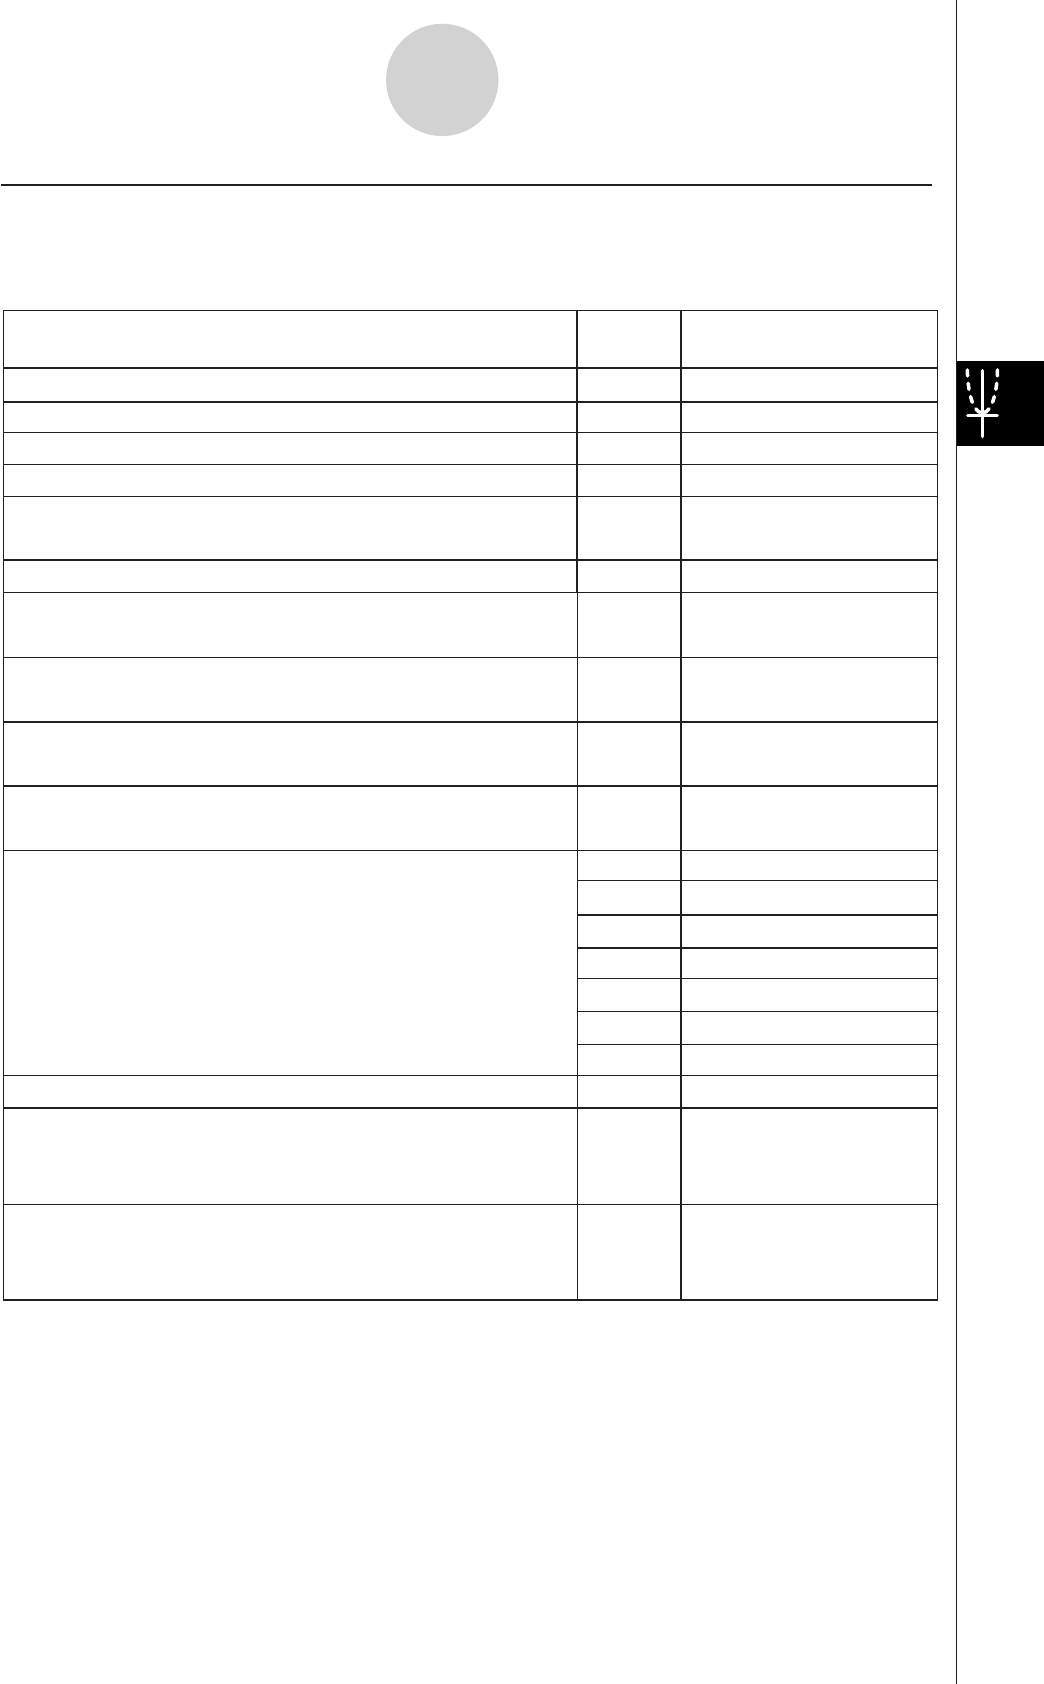
Zoom - Square
—
Zoom - Round
Zoom - Integer
—
Zoom - Previous
Zoom - Quick Initialize
—
Zoom - Quick Trig
Zoom - Quick log(
x
)
—
Zoom - Quick e^
x
Zoom - Quick
x
^2
—
Zoom - Quick –
x
^2
—
—
—
—
—
—
=
Analysis - Trace
—
Analysis - Sketch
—
Analysis
-
G-Solve
Insert a point, graphic, or text into an existing graph
• For details about this operation, see “3-6 Using the
Sketch Menu”.
Perform a G-Solve operation
• For details about this operation, see “4-5 Using
G-Solve to Analyze a Conics Graph”.
Display the coordinates at a particular point on a graph
Perform a quick zoom operation (page 3-2-9)
Adjust View Window
x
-axis values so they are identical
to the
y
-axis values
Round coordinate values displayed using Trace
(page 4-4-1)
Make the value of each dot equal 1, which makes all
coordinate values integers
Return View Window parameters to their settings prior
to the last zoom operation
Zoom - Quick Standard
To do this:
Tap this
button:
Or select this
menu item:
Q
Zoom - Box
—
Zoom - Factor
—
Zoom - Zoom In
— Zoom - Zoom Out
R
Zoom - Auto
Zoom - Original
—
Enlarge the part of the screen bounded by a box
Specify a zoom factor
Zoom in by the zoom factor
Zoom out by the zoom factor
Return a graph to its original size
Configure View Window
y
-axis parameters and redraw
the graph so it fills the Graph window along the
y
-axis
4-1-3
Conics Application Overview
I
Conics Graph Window Menus and Buttons
The following describes the menu and button operations you can perform while the Conics
Graph window is active.


