


20060301
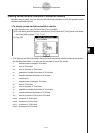
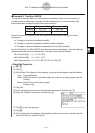
Viewing Regression Calculation Results
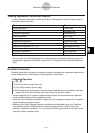
To view regression calculation results, tap [Calc] on the menu bar and then tap the type of
calculation results you want.
7-7-3
Performing Statistical Calculations
• You can also use the [DispStat] option to display the last calculated statistical results. For
details about regression calculation results, see “7-5 Graphing Paired-Variable Statistical
Data”.
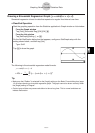
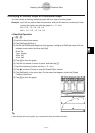
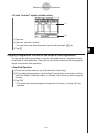
Residual Calculation
Residual calculation calculates the distance (residual) between the regression model and an
actual plotted point (
y
-coordinates) during regression calculations.
S
ClassPad Operation
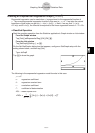
(1)
/
(2) Input the data you want into a list.
(3) Tap [Calc] and then [Linear Reg].
(4) On the dialog box that appears, tap the [Copy Residual] down arrow button, and then
select [On] or the list into which you want to copy the residual values.
• Values assigned to the “residual” system variable shows the vertical distances between
actually plotted points and the regression model.
• A positive value indicates a plot that is higher than the regression model, while a negative
value indicates a plot that is lower.
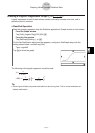
• Whenever the [Copy Residual] setting is configured as described above, the ClassPad
automatically assigns residual data to a system variable named “residual” when you
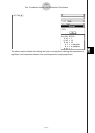
perform a regression calculation. You can use the following procedure to view the current
“residual” system variable values.
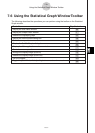
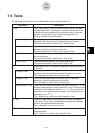
Linear regression
Linear Reg
Med-Med
MedMed Line
Quadratic regression
Quadratic Reg
Cubic regression
Cubic Reg
Quartic regression
Quartic Reg
Logarithmic regression
Logarithmic Reg
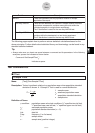
Exponential regression (
y = a·e
b
·
x
)
Exponential Reg
Exponential regression (
y = a·b
x
)
abExponential Reg
Power regression
Power Reg
Sinusoidal regression
Sinusoidal Reg
Logistic regression
Logistic Reg
Tap this option:
To view these calculation results: