


20090601
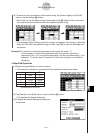
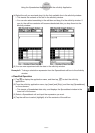
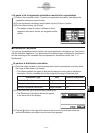
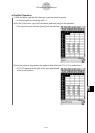
Example: To execute paired-variable calculations and display a list of statistical values
(1) Enter the paired-variable data into the spreadsheet, and then select the range of cells
where it is located.
(2) On the menu bar, tap [Calc] and then [Two-Variable].
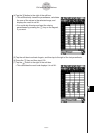
• For details about the meaning of each value that appears as a statistical calculation
result, see “Viewing Single-variable Statistical Calculation Results” (page 7-7-1) and
“Viewing Paired-variable Statistical Calculation Results” (page 7-7-2).
I
Regression Calculations
You can use regression calculation to determine the regression formula that approximates
paired-variable spreadsheet data. Regression calculations results are displayed as a list of
coefficients for the regression model formula.
Tip
For information about regression graphing, see “Regression Graph Operations” (page 13-9-15).
S
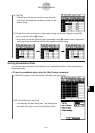
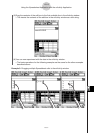
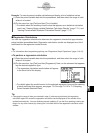
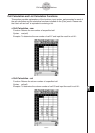
To perform a regression calculation
(1) Enter the paired-variable data into the spreadsheet, and then select the range of cells
where it is located.
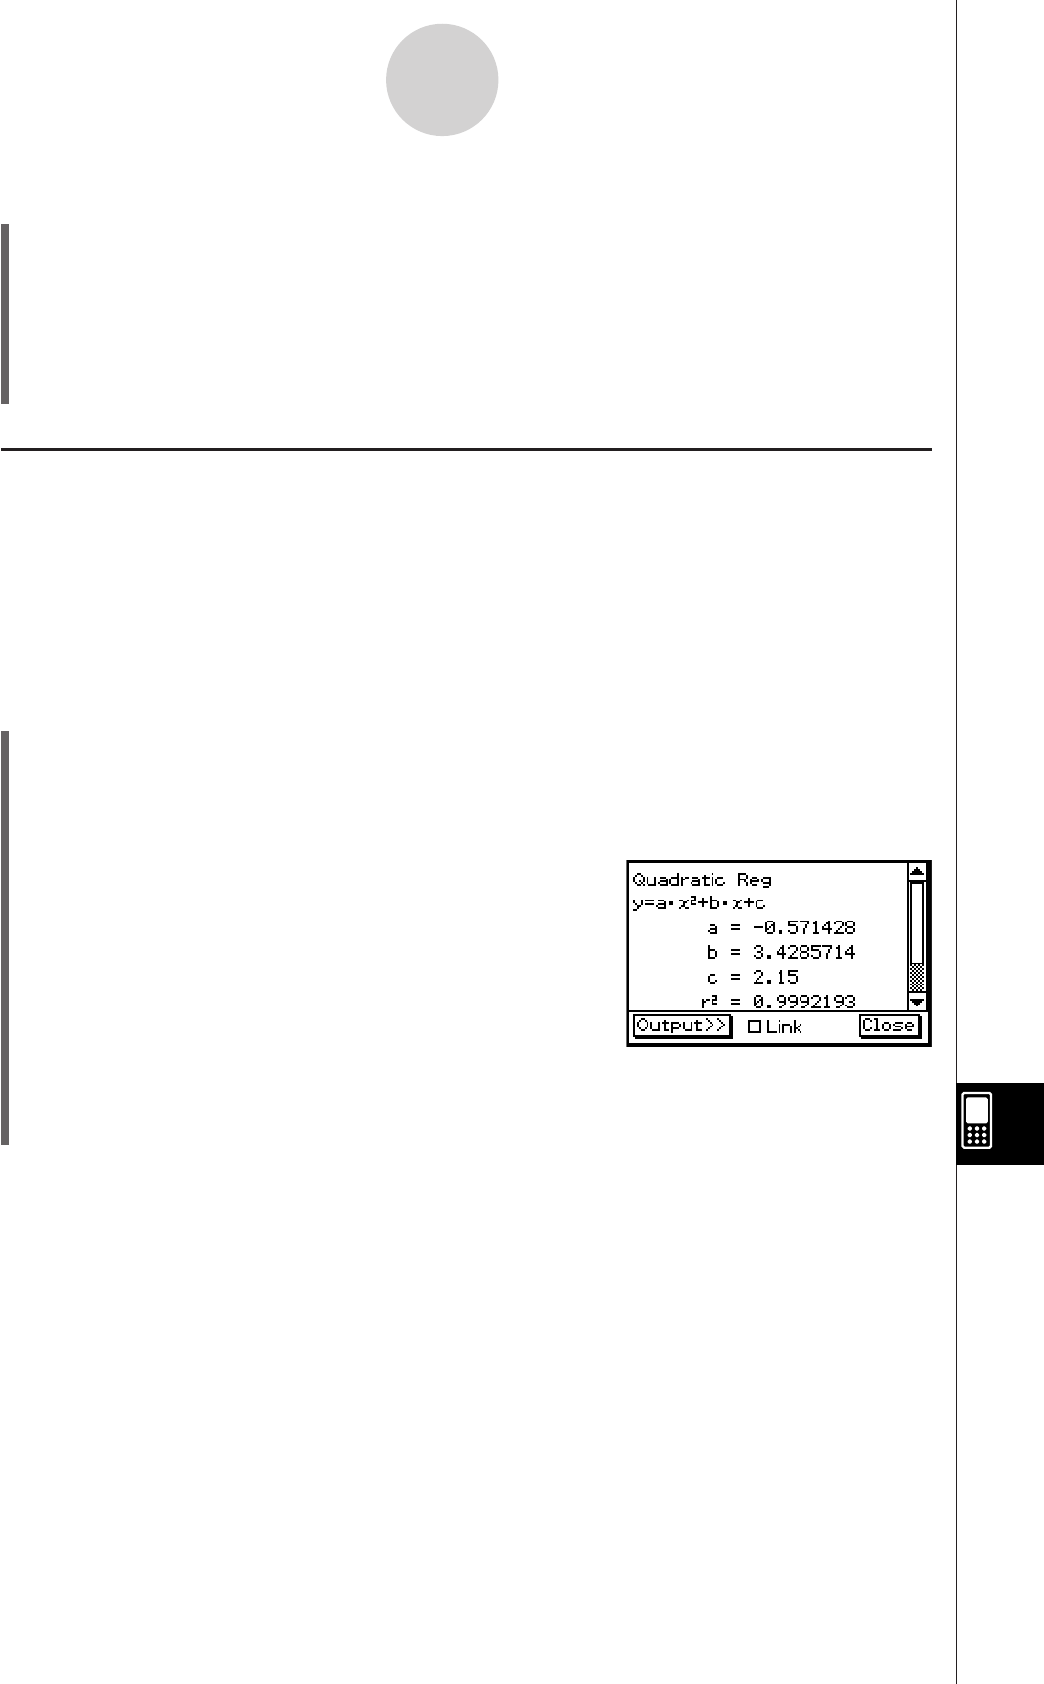
(2) On the menu bar, tap [Calc] and then [Regression]. Next, on the submenu that appears,
tap the desired regression type.
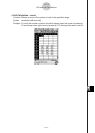
• The regression calculation result window will appear
in the lower half of the display.
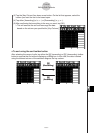
• For details about the model formula for the selected regression type and the meaning
of each coefficient that appears, see pages 7-5-5 through 7-5-14 in “7-5 Graphing
Paired-Variable Statistical Data”.
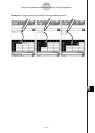
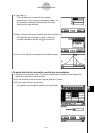
Tip
Changing the range of data you selected in step (1) above and performing the regression
calculation again will cause the regression calculation results displayed on the window to be
updated automatically. You can disable automatic updating (if you feel that updating is taking too
long or for any other reason) by clearing the Link check box on the regression calculation result
window.
•
•
13-6-2
Statistical Calculations