


20060301
I
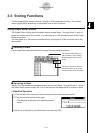
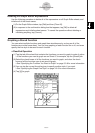
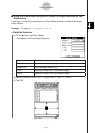
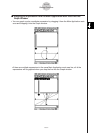
Quick Graphing of an Expression Using Drag and Drop
You can use the following procedure to graph a single function, even when you have multiple
functions selected on the Graph Editor window.
S
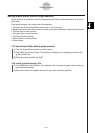
ClassPad Operation
(1) Tap the tab of the sheet that contains the function you want to graph to make it active.
(2) Drag the function you want to graph to the Graph window.
Tip
• The above drag and drop procedure can be used to graph a function, regardless of whether the
function’s check box is selected or cleared.
• When you quick graph a function using drag and drop, the function is always treated as a “
y
=”
expression, regardless of the graph type specified for the function.
• Up to 30 of the graphs you draw in the Graph window are stored in memory as you draw them.
This includes graphs drawn from Graph Editor window functions, graphs drawn using the Sketch
functions (Tangent, Normal, Inverse), and graphs drawn using the drag and drop operation
described above. Though you can draw more than 30 graphs at one time, any graphs after the
30th are not stored in memory.
• All of the Graph window graphs that are currently stored in memory are redrawn when you scroll
the Graph window or tap the [ReDraw] command on the
(
menu. Since only 30 graphs are
stored in memory, anything drawn after the 30th graph is not redrawn. Keep this limitation in mind
when you draw a large number of graphs at the same time.
I
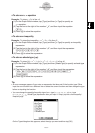
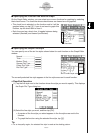
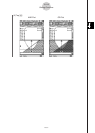
Overlaying Two Inequalities in an AND Plot / OR Plot
Use the following procedure to overlay two inequalities in an AND Plot or OR Plot which are
described below.
• AND Plot
With an AND Plot, only the parts of the inequalities that overlap are shaded.
• OR Plot
With an OR Plot, the inequalities are overlaid as they are.
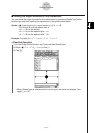
Example: To graph the inequalities
y
<
x
2
,
y
x
+ 1
S
ClassPad Operation
(1) Store
y
<
x
2
in line
y
1 and
y
x
+ 1 in line
y
2.
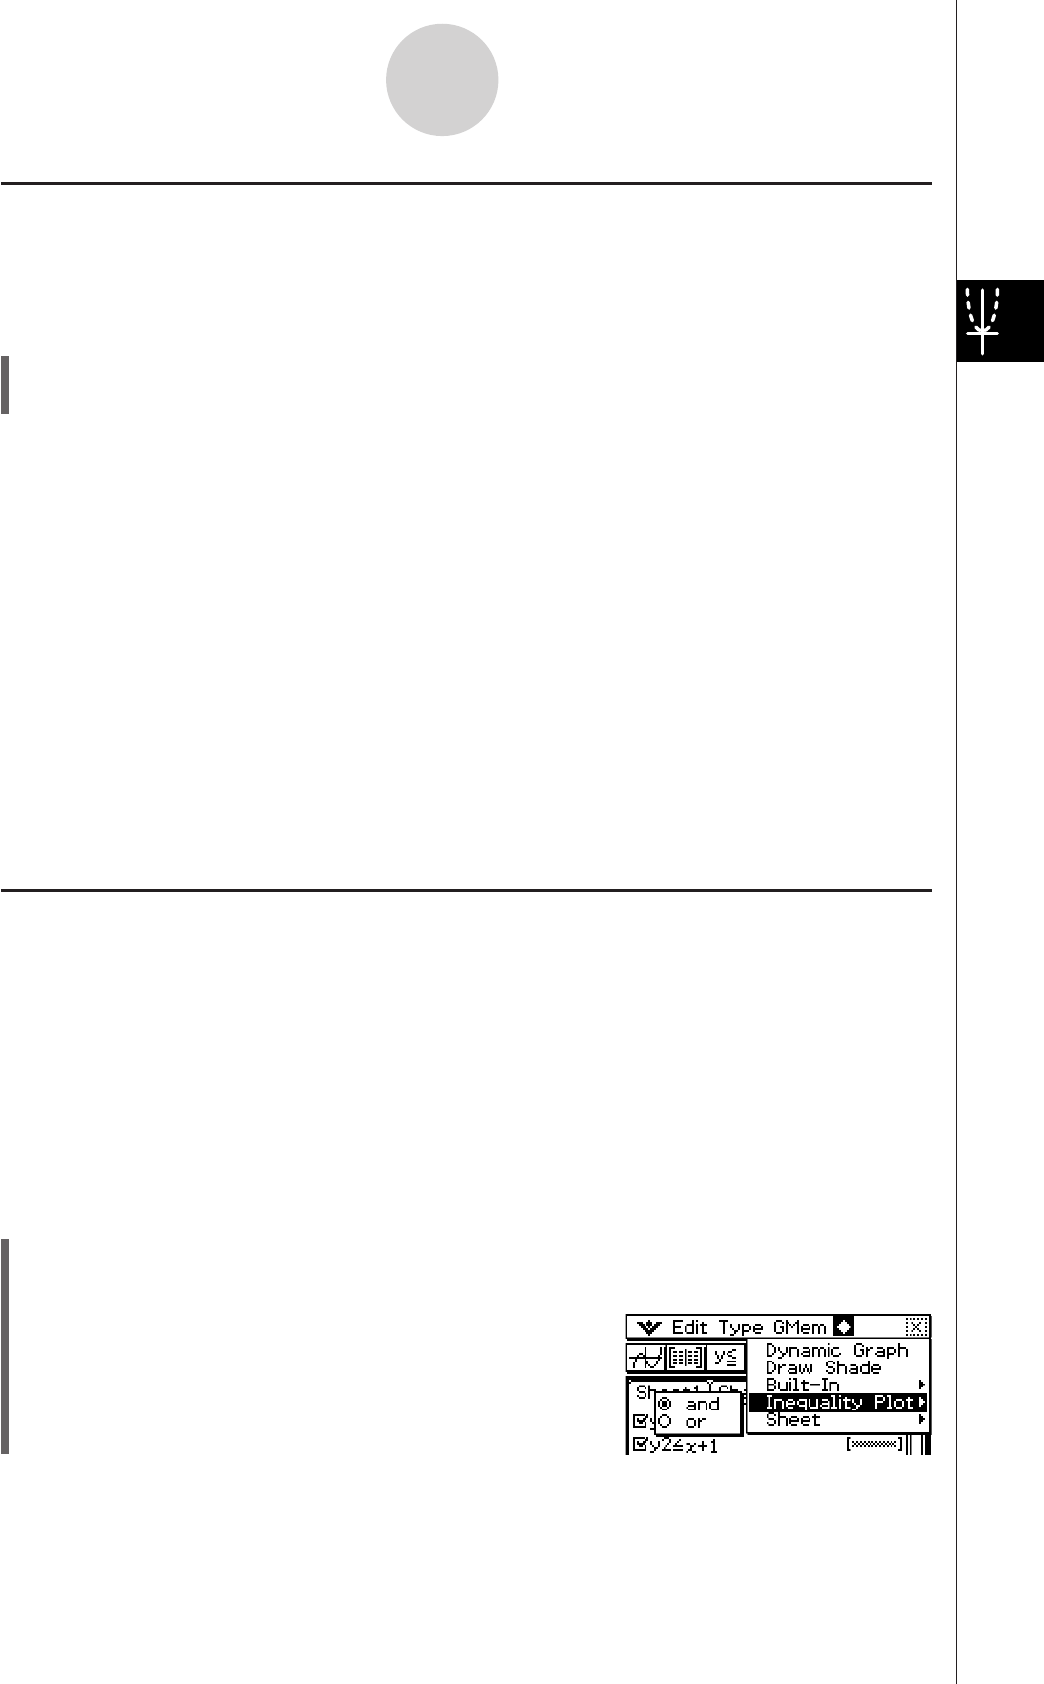
(2) On the
(
menu, tap [Inequality Plot].
Select [and] or [or] on the submenu that appears.
3-3-9
Storing Functions