


Debug Module
MCF52211 ColdFire® Integrated Microcontroller Reference Manual, Rev. 2
Freescale Semiconductor 28-3
28.3 Real-Time Trace Support
Real-time trace, which defines the dynamic execution path and is also known as instruction trace, is a
fundamental debug function. The ColdFire solution is to include a parallel output port providing encoded
processor status and data to an external development system. This port is partitioned into two 4-bit nibbles:
one nibble allows the processor to transmit processor status, (PST), and the other allows operand data to
be displayed (debug data, DDATA).The processor status may not be related to the current bus transfer, due
to the decoupling FIFOs.
External development systems can use PST outputs with an external image of the program to completely
track the dynamic execution path. This tracking is complicated by any change in flow, where branch target
address calculation is based on the contents of a program-visible register (variant addressing). DDATA
outputs can display the target address of such instructions in sequential nibble increments across multiple
processor clock cycles, as described in Section 28.3.1, “Begin Execution of Taken Branch (PST = 0x5)”.
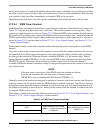
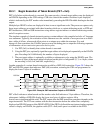
Two 32-bit storage elements form a FIFO buffer connecting the processor’s high-speed local bus to the
external development system through PST[3:0] and DDATA[3:0]. The buffer captures branch target
addresses and certain data values for eventual display on the DDATA port, one nibble at a time starting
with the least significant bit (lsb).
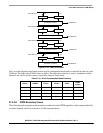
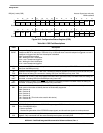
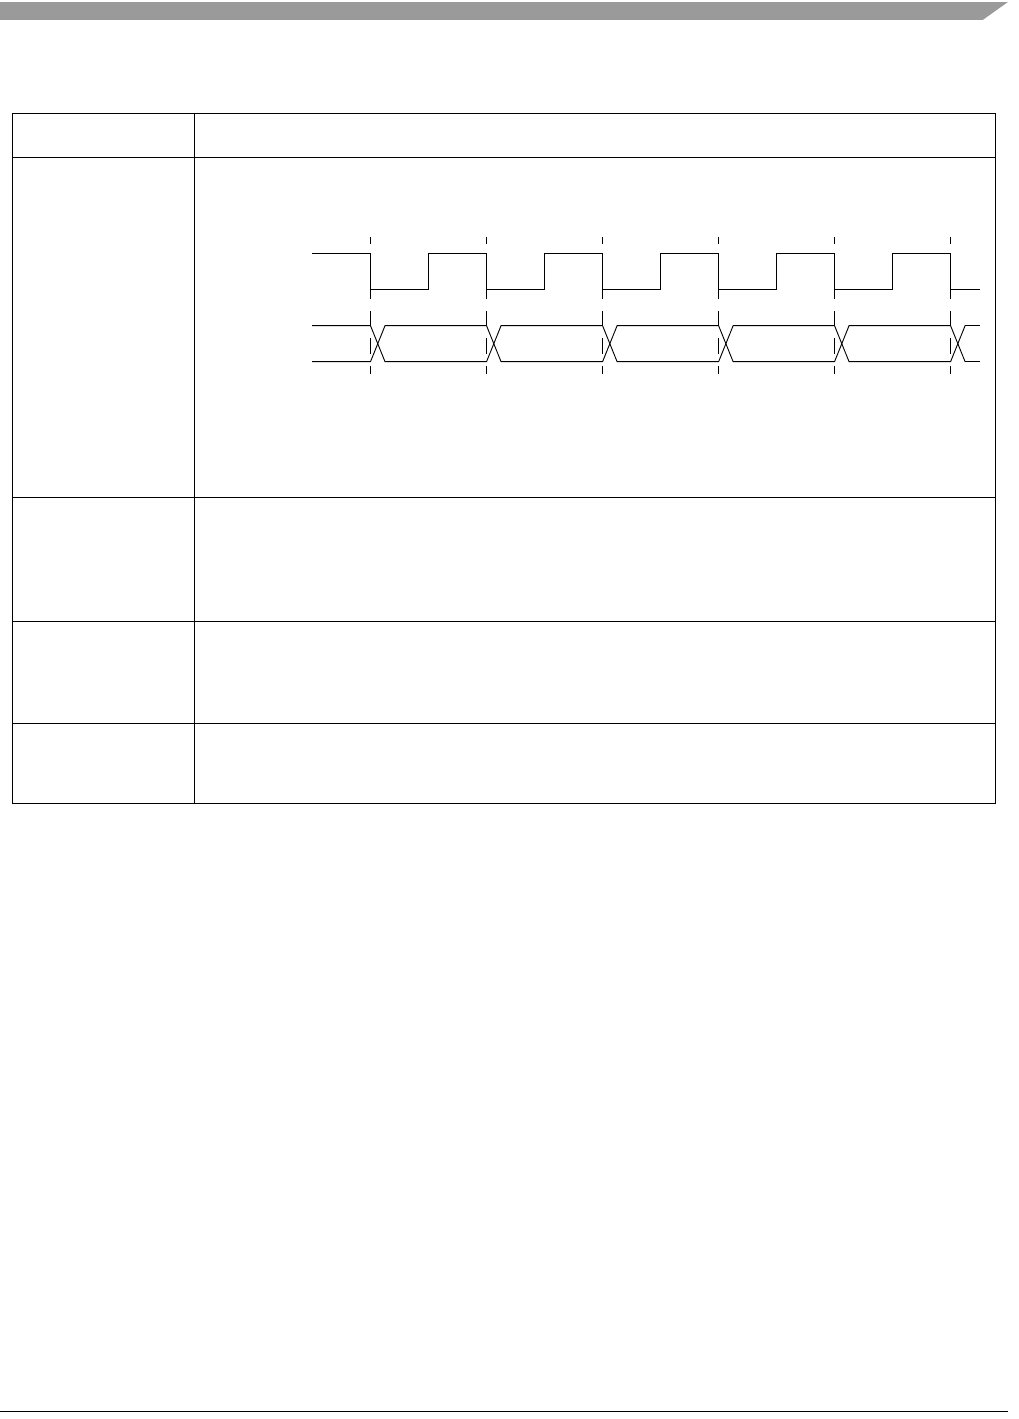
Processor Status
Clock (PSTCLK)
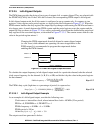
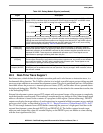
Delayed version of the processor clock. Its rising edge appears in the center of valid PST and DDATA
output. PSTCLK indicates when the development system should sample PST and DDATA values.
The following figure shows PSTCLK timing with respect to PSTD and DATA.
If real-time trace is not used, setting CSR[PCD] keeps PSTCLK, PST and DDATA outputs from
toggling without disabling triggers. Non-quiescent operation can be reenabled by clearing CSR[PCD],
although the external development systems must resynchronize with the PST and DDATA outputs.
PSTCLK starts clocking only when the first non-zero PST value (0xC, 0xD, or 0xF) occurs during
system reset exception processing. Tabl e 28 -3 describes PST values.
Debug Data
(DDATA[3:0])
These output signals display the register breakpoint status as a default, or optionally, captured
address and operand values. The capturing of data values is controlled by the setting of the CSR.
Additionally, execution of the WDDATA instruction by the processor captures operands which are
displayed on DDATA. These signals are updated each processor cycle. These signals are not
implemented on packages containing fewer than 100 pins.
Processor Status
(PST[3:0])
These output signals report the processor status. Tabl e 28 -3 shows the encoding of these signals.
These outputs indicate the current status of the processor pipeline and, as a result, are not related to
the current bus transfer. The PST value is updated each processor cycle. These signals are not
implemented on packages containing fewer than 100 pins.
All Processor Status
Outputs (ALLPST)
ALLPST is a logical ‘AND’ of the four PST signals and is provided on all packages. PST[3:0] and
DDATA[3:0] are not available on the low cost (less than 100 pin) packages. When asserted, reflects
that the core is halted.
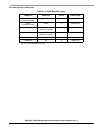
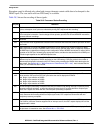
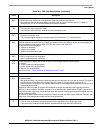
Table 28-2. Debug Module Signals (continued)
Signal Description
PSTCLK
PST or DDATA