Statistics Menu 85
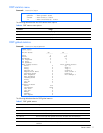
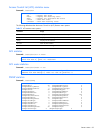
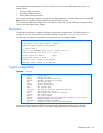
The following table describes the NTP statistics:
Table 75 NTP statistics
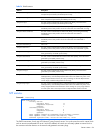
Statistics Description
Primary Server Requests Sent: The total number of NTP requests the switch sent to the primary NTP
server to synchronize time.
Responses Received: The total number of NTP responses received from the primary
NTP server.
Updates: The total number of times the switch updated its time based on the NTP
responses received from the primary NTP server.
Secondary Server Requests Sent: The total number of NTP requests the switch sent to the secondary NTP
server to synchronize time.
Responses Received: The total number of NTP responses received from the secondary
NTP server.
Updates: The total number of times the switch updated its time based on the NTP
responses received from the secondary NTP server.
Last update based on
response from primary
server
Last update of time on the switch based on either primary or secondary NTP response
received.
Last update time The time stamp showing the time when the switch was last updated.
Current system time The switch system time when the command /stats/ntp was issued.
Link statistics
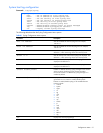
Command: /stats/port <port number>/link
Link statistics for port 1:
linkStateChange: 1
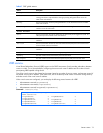
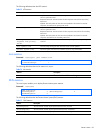
The following table describes the link statistics for a port:
Table 76 Link statistics
Statistics Description
linkStateChange The total number of link state changes.
DNS statistics
This menu option enables you to display Domain Name system statistics.
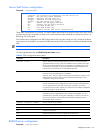
Command: /stats/dns
DNS statistics:
dnsInRequests: 0 dnsOutRequests: 0
dnsBadRequests: 0
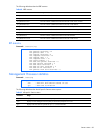
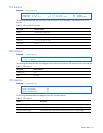
The following table describes the Domain Name System (DNS) statistics:
Table 77 DNS statistics
Statistic Description
dnsInRequests The total number of DNS request packets that have been received.
dnsOutRequests The total number of DNS response packets that have been transmitted.
dnsBadRequests The total number of DNS request packets received that were dropped.


