


Special Procedures 189
6-00020-02
SNC 5100
Event Log Dump
The events that have been logged in the SNC 5100’s Event Log can be
displayed on the service terminal or viewed from the ADIC Management
Console.
For more information, see the ADIC Management Console User Guide.
This information may be useful because you can see the normal events and any
abnormal events that may lead you to the source of an internal or external
failure.
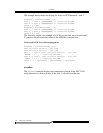
Each entry contains a sequence number, day, and time-stamp, the event code,
event source (interface name or system process), an index, and a description of
the event.
If the Real Time Clock has been set, the time-stamp will be real time.
Otherwise, the time stamp will be relative to the boot-time.
The Event Log holds more than 2000 events. When the log becomes full, the
oldest events are overwritten by the most recent events.
You can choose to view only those events logged since the SNC 5100 was last
booted or you can view a longer list of events that have accumulated from
previous boots.
You can choose to view events by severity level. Selecting Warning will
display Warning and Notice events. Selecting Information will display
Information, Warning and Notice events.
See the
"loggerDump [number]" command on page 141 or the
"loggerDumpCurrent [level]"
command on page 142.
See also Figure 6 on page 35, “Detail of Event Log Listing From Service Port.”
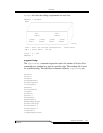
Retrieving the Code 43 Dump File
If an event code 43 was reported to the ADIC Management Console client, it is
an indication that the SNC 5100 performed an error recovery operation and had
to reset the Fibre Channel interface to clear a lock-up condition.
For more information, see the ADIC Management Console User Guide.