


6-6
Cisco WAN Modeling Tools Guide
OL-10426-01, Rev. A0
Chapter 6 NMT Reports
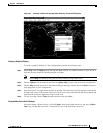
Using the Map Tool
Note The Access, Domains and Help menus, and the Configure option in the Utility menu, are not enabled.
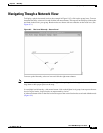
To enlarge a region of the map, hold down the left mouse button and select the region of the map you
want to enlarge. To move a map, hold down the middle mouse button and drag the map within the
window. To reduce an enlarged map, click one or more times on the right mouse button with your cursor
in the map window. To return a map to its default size, reselect the map from the Map menu.
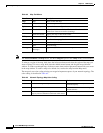
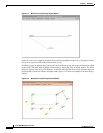
The map tool uses color coding to help you recognize important aspects of your network topology. The
color coding is described in Table 6-2.
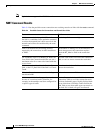
Table 6-2 Map Tool Menus
Menu Bar Selection Description
Map Map Show or hide the map.
Select Select a map.
Update Update Map Import the latest configuration.
Options Thresholds Define thresholds at which traffic is considered excessive
(critical) or close to excessive (warning).
Black and White Display the map in black and white.
Utility Reset Clear the map.
About Describes the map application.
Save Save the map.
Quit Close the map.
Messages Browse
Messages
Appears only if there are error messages.
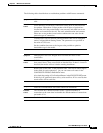
Table 6-3 Network Topology Map Color Coding
Color Node Link
Green Node is functioning normally. Link is functioning normally and is below
threshold capacity.
Yellow Not applicable. Link is above minimum but below high
percent tolerance.
Red Node is not working (or is being used for failure
analysis), Not all connections at this node could reroute.
Link is above capacity threshold tolerance.