


6-7
Cisco WAN Modeling Tools Guide
OL-10426-01, Rev. A0
Chapter 6 NMT Reports
Using the Map Tool
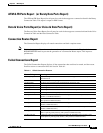
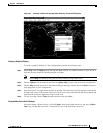
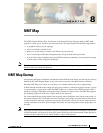
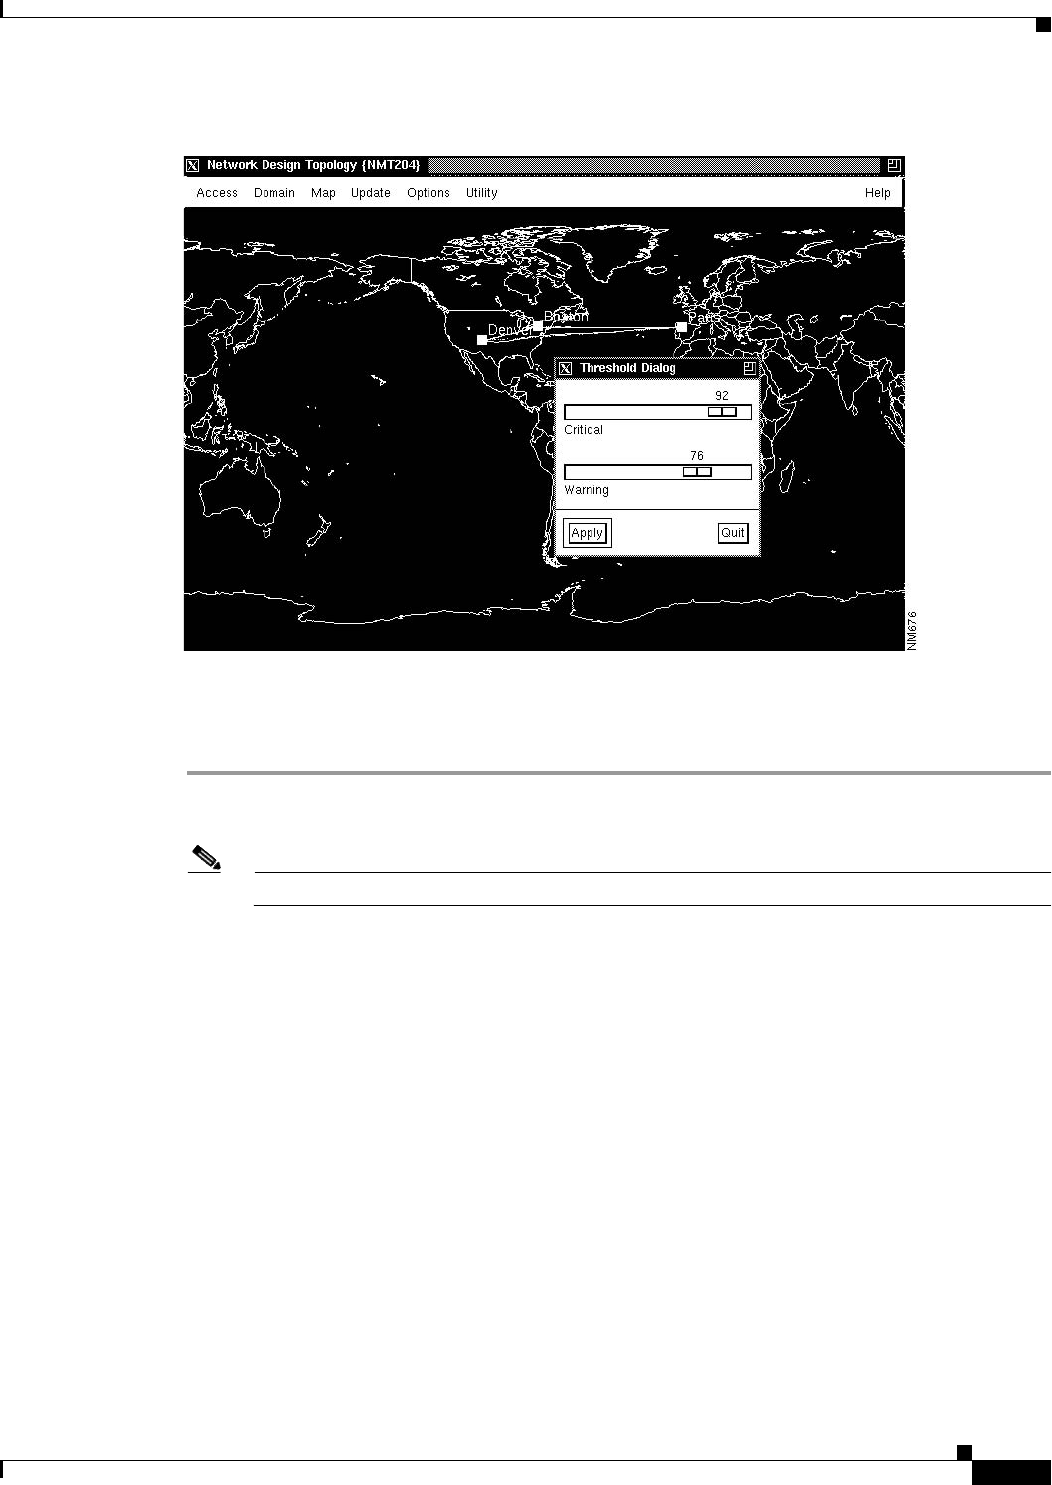
Figure 6-1 Example of Network Topology Map Showing Threshold Dialog Box
Creating a Graphical Display
To create a graphical display of a new configuration, perform the following steps:
Step 1 Select Map from the Display menu and drag the Map window to a suitable location on your screen. It
may take several seconds for the Map window to display.
Note Select Map tool menus by using the left mouse button, except where noted.
Step 2 Choose Update from the menu bar and click on Update Map to import the most recent configuration.
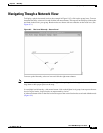
Step 3 Choose Map from the menu bar in the Network Design Topology window and click Select to choose a
map appropriate to your configuration.
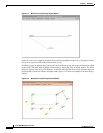
Step 4 Drag each node to its approximate location on the map. The node icons (colored squares) are stacked in
the upper left corner of the window. Place your cursor over a node, hold down the left mouse button, and
drag the node into place. Repeat this step for each node.
Step 5 To save your map, choose Utility from the menu bar and select Save.
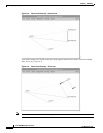
Using the Map Tool with Fail Analysis
After performing a failure analysis, click on Update in the map window menu bar, and select Update
Map. Any site that did not reroute a connection for any of the link failures turns red.