RTR Monitoring
5.2 Standard Monitor Pictures
Note
Obsolete monitor pictures have been removed from the documentation.
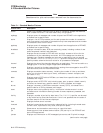
Table 5–1 Standard Monitor Pictures
Picture name Description
accfail Shows link transport name for links on which a connection attempt was declined,
with a reason for failure. The most recent entry is highlighted.
acp2app Displays counts of messages and number of bytes from RTRACP to the application,
as viewed from a specific node.
active Displays a list of RTR processes, and for each process the number of transactions
they have started, the number of transactions they have completed and the number
of transactions that are still active.
app2acp Displays counts of messages and number of bytes from the application to RTRACP,
as viewed from a specific node.
broadcast Displays information about RTR user events by process, including number of user
events enqueued, received, and discarded.
calls Displays the total number of RTR API calls and their success or failure for the
processes on all the nodes being monitored. All RTR message are also show by
message type. (Pending messages are ones that an application has not received
yet). Use the
/IDENTIFICATION=process-id
qualifier to display the values for one
specific process, otherwise the total values for all processes are displayed.
channel Displays the roles of the channels declared by an application. This can be useful as a
debugging tool in the early stages of application development.
congest Displays a sorted list of nodes responsible for causing the most congestion since RTR
was last started, and the instantaneous state.
connects Displays connection status summary, including the number of links up and down,
and a list of links with state (up or down), architecture, network transport, and
fail-reason, if any.
ddtm Displays counts of RTR calls to DECdtm, as viewed from a specific node, for all PIDs,
processes, and images.
dtx Displays counts of RTR DTX calls including open, start, prepare, rollback, commit,
and close, as viewed from a specific node for all PIDs, processes, and images.
dtxrec Displays a summary of DECdtm transaction recovery (DTX), as viewed from a
specific node for all PIDs, processes, and images.
event Displays event routing data by facility. Information includes events in transit
and destination information showing number of events enqueued, processed, and
discarded.
facility Displays a number of per facility data items. The
/FACILITY
qualifier can be used
to say which facility should be monitored. If this is not specified then the totals of
the data items for all facilities are displayed.
flow Displays the flow control counters.
frontend Displays frontend status and counts by node and facility, including frontend state
current router, reject status, retry count, and quorum rejects.
group Shows server and transaction concurrency on a partition basis.
ipc Shows counts of inter-process communication (IPC) activity in the RTR ACP and
active RTR applications.
ipcrate Displays rate information on IPC messages, byte counts, and IO primitive usage.
(continued on next page)
5–2 RTR Monitoring


