


RTR Monitoring
5.2 Standard Monitor Pictures
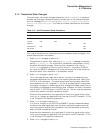
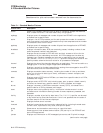
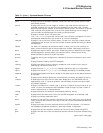
Table 5–1 (Cont.) Standard Monitor Pictures
Picture name Description
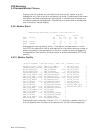
jcalls Displays counts of successful (success), failed (fail) and total journal calls for local
and remote journals.
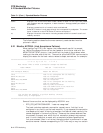
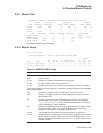
journal Displays the current journal usage on a node. Local node journal statistics are
provided, and data for non-local journals accessed from the local node. Include
statistics covering total number of entries and records written, the number of records
read, and how many bytes were involved. Bar graphs showing current usage of
journal blocks (as a percentage of the total) are also provided.
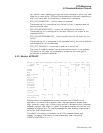
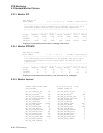
link Displays a number of per link data items.
The
/LINK=link-name
qualifier can be used if the values for one specific link are to
be displayed, otherwise the total values for all links are displayed.
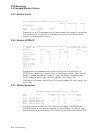
netbytes Displays a list of the links to other nodes. For each link, the total number of bytes
received and sent on that link and the number of bytes received and sent per second
are displayed.
netstat For each link, displays the connection status in detail, with the link state (up or
down), and architecture type of remote node (such as VAX, I386, Alpha, and so on).
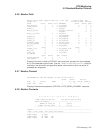
partit Displays the status of server partitions. Shows the partition identifiers, key ranges
and key segments, and the status of the servers (active, recovering and so on).
queues Shows transaction queues on a partition basis.
quorum Tracks (by facility) the configuration, reachability and quorum status of one or more
nodes.
rdm Displays memory used by each RTR subsytem.
recovery Displays the status of server recovery procedures, such as waiting for quorum,
catching up transactions, and so on.
rejects Displays the last
rtr_mt_rejected
message received by each running process.
rejhist Displays the last ten
rtr_mt_rejected
messages received by the selected process.
response Displays the elapsed time that a transaction has been active on the opened channels
of a process.
rfb Displays router failback operations, including both a summary and detail by facility.
rolequor A detailed picture of the various data items displayed in the QUORUM picture,
separated by roles. If a quorum problem is encountered, this picture may be useful
for problem diagnosis.
routers Displays information on a router node. It gives an indication of the utilization of the
router in terms of transactions and broadcasts routed through this node. Useful to
monitor performance, or locate problems.
routing Displays statistics of transaction and broadcast traffic by facility.
rscbe Displays the most recent calls history for the RSC subsystem on a backend node.
rtr Displays various per node data items.
stalls Displays in real time any network links that are currently stalling in their outbound
traffic, and provides a history of the stalls that the various links encountered during
their lifetime.
system Displays the state of critical resources within the RTR environment. If a resource
has exceeded a predefined threshold, a warning indicator is displayed.
tps Displays the rate of transaction commits carried out by each process using RTR.
tpslo Displays low end of the rate of transaction commits carried out by each process using
RTR.
(continued on next page)
RTR Monitoring 5–3