


Graphics4-10
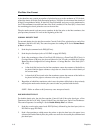
Plotting the Data
P-Series
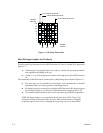
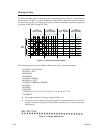
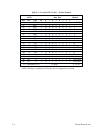
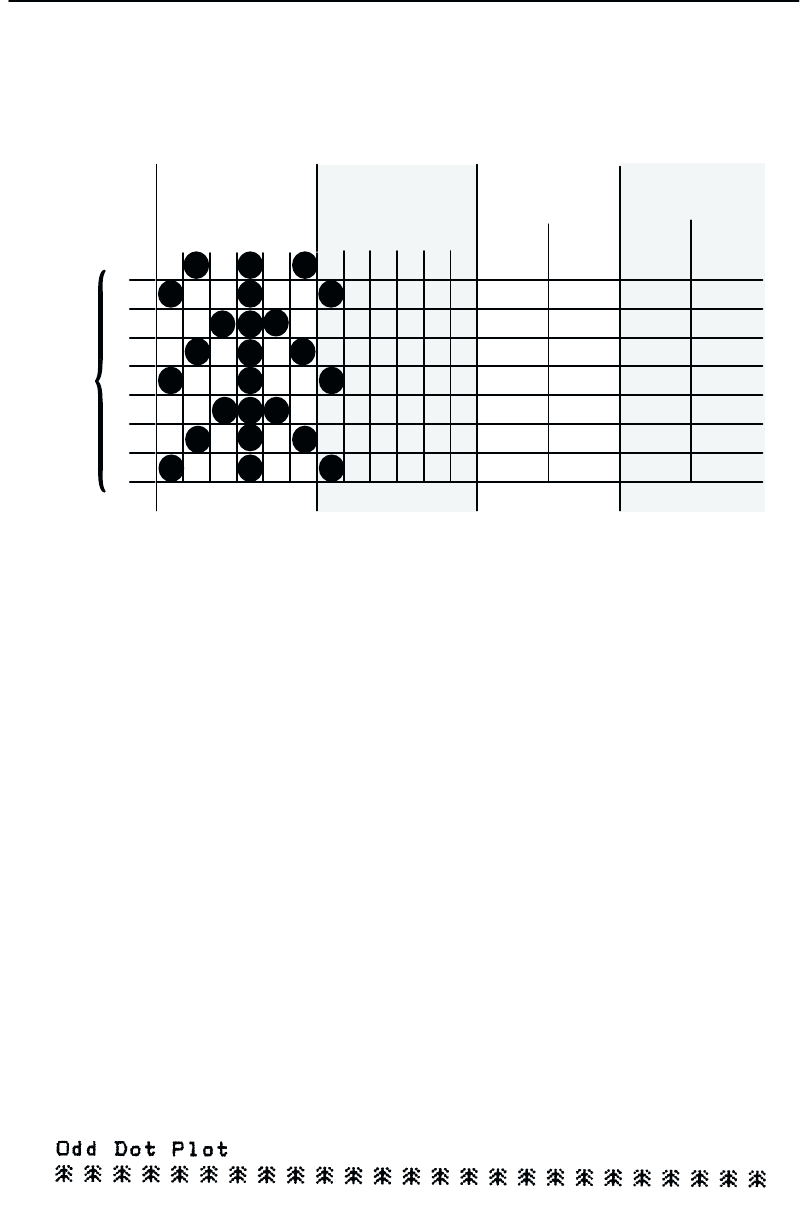
Plot Mode plots the image from the horizontal
bit pattern. Figure 4-8 duplicates the
pattern shown in Figure 4-4 but is modified for Odd Dot Plot. Eight dot rows are required,
two characters per row, six columns per character. (The dots required to produce the pattern
are
shown in NO T
AG on page NO TAG.)
1
2
3
4
5
6
7
8
13 11579 13 11579
1st
CHARACTER
ODD COLUMNS
2nd
CHARACTER
ODD COLUMNS
1st
CHARACTER
ASCII DECIMAL
2nd
CHARACTER
ASCII DECIMAL
42
73
92
42
73
92
42
73
*
|
\
*
|
\
*
|
64
65
64
64
65
64
64
65
@
A
@
@
A
@
@
A
DOT
ROW
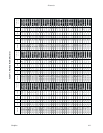
Figure 4-8. Odd Dot Plot P
attern Plan
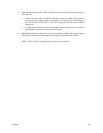
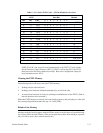
The following program uses the Odd Dot Plot control code to produce the image.
10 LPRINT
”
Odd Dot Plot
”
20 FOR I=1 TO 8
30 READ R1
40 READ R2
50 LPRINT CHR$(5);
60 FOR N=1 TO 25
70 LPRINT CHR$(R1);CHR$(R2);
80 NEXT N
90 LPRINT
100 NEXT I
110 DATA 42, 64, 73, 65, 92, 64, 42, 64, 73, 65, 92, 64, 42, 64, 73, 65
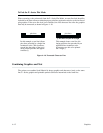
120 LPRINT
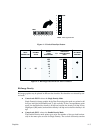
D
The image is printed 25 times as shown in Figure 4-9.
D An
entire dot row is plotted in one
printing pass. Consequently, the first row of all 25
images is printed in one pass, followed by the second row, etc, until all rows have
been
printed.
Figure 4-9. Sample Odd Dot Plot