


81-7
Cisco ASA 5500 Series Configuration Guide using ASDM
Chapter 81 Troubleshooting
Testing Your Configuration
Tracing Packets with Packet Tracer
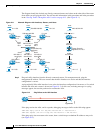
The packet tracer tool provides packet tracing for packet sniffing and network fault isolation, as well as
detailed information about the packets and how they are processed by the ASA. If a configuration
command did not cause the packet to drop, the packet tracer tool provides information about the cause
in an easily readable manner.
In addition, you can trace the lifespan of a packet through the ASA to see whether the packet is operating
correctly with the packet tracer tool. This tool enables you to do the following:
• Debug all packet drops in a production network.
• Verify the configuration is working as intended.
• Show all rules applicable to a packet, along with the CLI commands that caused the rule addition.
• Show a time line of packet changes in a data path.
• Inject tracer packets into the data path.
• Search for an IPv4 or IPv6 address based on the user identity and the FQDN.
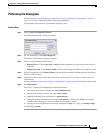
To open the packet tracer, perform the following steps:
Step 1 In the main ASDM application window, choose Tools > Packet Tracer.
The Cisco ASDM Packet Tracer dialog box appears.
Step 2 Choose the source interface for the packet trace from the drop-down list.
Step 3 Specify the protocol type for the packet trace. Available protocol types include ICMP, IP, TCP, and UDP.
Step 4 Enter the source IP address for the packet trace in the Source IP Address field.
Step 5 For TCP and UDP only, choose the source port for the packet trace from the drop-down list.
Step 6 Enter the destination IP address for the packet trace in the Destination IP Address field.
Step 7 For TCP and UDP only, choose the destination port for the packet trace from the drop-down list.
Step 8 For ICMP only, choose the type of packet trace from the Type drop-down list. Then enter the trace code
and trace ID in the appropriate fields.
Step 9 For IP only, enter the protocol number in the Protocol field. Valid values range from 0 to 255.
Step 10 Click Start to trace the packet.
The Information Display Area shows detailed messages about the results of the packet trace.
Note To display a graphical representation of the packet trace, check the Show animation check box.
Step 11 Click Clear to start a new packet trace.
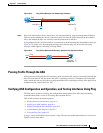
Handling TCP Packet Loss
To troubleshoot TCP packet loss, see the “Customizing the TCP Normalizer with a TCP Map” section
on page 57-6 for more information.