


12-39
Cisco ASA 5500 Series Configuration Guide using ASDM
Chapter 12 Starting Interface Configuration (ASA 5510 and Higher)
Monitoring Interfaces
• Interface Graphs, page 12-39
ARP Table
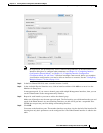
The Monitoring > Interfaces > ARP Table pane displays the ARP table, including static and dynamic
entries. The ARP table includes entries that map a MAC address to an IP address for a given interface.
Fields
• Interface—Lists the interface name associated with the mapping.
• IP Address—Shows the IP address.
• MAC Address—Shows the MAC address.
• Proxy ARP—Displays Yes if proxy ARP is enabled on the interface. Displays No if proxy ARP is
not enabled on the interface.
• Clear—Clears the dynamic ARP table entries. Static entries are not cleared.
• Refresh—Refreshes the table with current information from the ASA and updates Last Updated date
and time.
• Last Updated—Display only. Shows the date and time the display was updated.
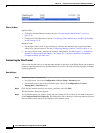
MAC Address Table
The Monitoring > Interfaces > MAC Address Table pane shows the static and dynamic MAC address
entries. See the “MAC Address Table” section on page 12-39 for more information about the MAC
address table and adding static entries.
Fields
• Interface—Shows the interface name associated with the entry.
• MAC Address—Shows the MAC address.
• Type—Shows if the entry is static or dynamic.
• Age—Shows the age of the entry, in minutes. To set the timeout, see the “MAC Address Table”
section on page 12-39.
• Refresh—Refreshes the table with current information from the ASA.
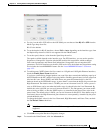
Interface Graphs
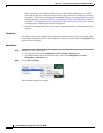
The Monitoring > Interfaces > Interface Graphs pane lets you view interface statistics in graph or table
form. If an interface is shared among contexts, the ASA shows only statistics for the current context. The
number of statistics shown for a subinterface is a subset of the number of statistics shown for a physical
interface.
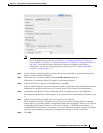
Fields
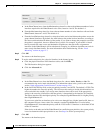
• Available Graphs for—Lists the types of statistics available for monitoring. You can choose up to
four types of statistics to show in one graph window. You can open multiple graph windows at the
same time.
–
Byte Counts—Shows the number of bytes input and output on the interface.