


5-22
Cisco ASR 1001-X Router Hardware Installation Guide
OL-32376-02
Chapter 5 Cisco ASR 1001-X Router Power Up and Initial Configuration
Environmental Monitoring and Reporting Functions
P2 ASR1001-X-FANTRAY ok 00:33:47
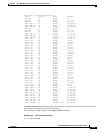
Slot CPLD Version Firmware Version
--------- ------------------- ---------------------------------------
0 14041015 15.4(2r)S
R0 14041015 15.4(2r)S
F0 14041015 15.4(2r)S
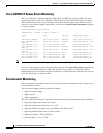
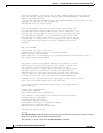
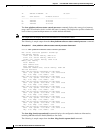
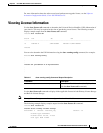
The show platform software status control-processor command displays the average load, memory
usage, and CPU utilization levels at which the router is running. The output also specifies whether the
levels of these system health parameters are within defined thresholds.
Note The output does not display SIP-related information on a monolithic router.
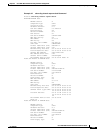
The following is sample output from the show platform software status control-processor command:
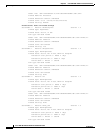
Example 5-6 show platform software status control-processor Command
Router# show platform software status control-processor
RP0: online, statistics updated 1 seconds ago
Load Average: healthy
1-Min: 0.00, status: healthy, under 8.00
5-Min: 0.03, status: healthy, under 8.00
15-Min: 0.07, status: healthy, under 10.00
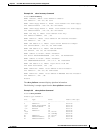
Memory (kb): healthy
Total: 8092776
Used: 3491556 (43%)
Free: 4601220 (57%)
Committed: 3566404 (44%), status: healthy, under 95%
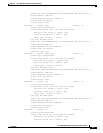
Per-core Statistics
CPU0: CPU Utilization (percentage of time spent)
User: 0.00, System: 0.00, Nice: 0.00, Idle:100.00
IRQ: 0.00, SIRQ: 0.00, IOwait: 0.00
CPU1: CPU Utilization (percentage of time spent)
User: 1.30, System: 0.40, Nice: 0.00, Idle: 98.30
IRQ: 0.00, SIRQ: 0.00, IOwait: 0.00
CPU2: CPU Utilization (percentage of time spent)
User: 0.49, System: 8.89, Nice: 0.00, Idle: 90.60
IRQ: 0.00, SIRQ: 0.00, IOwait: 0.00
CPU3: CPU Utilization (percentage of time spent)
User: 2.00, System: 0.40, Nice: 0.00, Idle: 97.60
IRQ: 0.00, SIRQ: 0.00, IOwait: 0.00
CPU4: CPU Utilization (percentage of time spent)
User: 0.00, System: 0.30, Nice: 0.00, Idle: 99.69
IRQ: 0.00, SIRQ: 0.00, IOwait: 0.00
CPU5: CPU Utilization (percentage of time spent)
User: 0.40, System: 0.10, Nice: 0.00, Idle: 99.50
IRQ: 0.00, SIRQ: 0.00, IOwait: 0.00
CPU6: CPU Utilization (percentage of time spent)
User: 0.40, System: 0.40, Nice: 0.00, Idle: 99.19
IRQ: 0.00, SIRQ: 0.00, IOwait: 0.00
CPU7: CPU Utilization (percentage of time spent)
User: 0.80, System: 1.30, Nice: 0.00, Idle: 97.90
IRQ: 0.00, SIRQ: 0.00, IOwait: 0.00
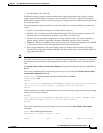
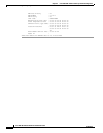
The show diag chassis eeprom detail command displays the configuration hardware information,
including DRAM and Static RAM (SRAM) on line cards.
The following is sample output from the show diag chassis eeprom detail command: