


Switch Manager
40 HP StorageWorks 2/8q Fibre Channel Switch Management User Guide
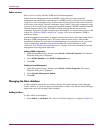
Deleting a link
To delete a link:
1. Select one or more links in the topology display, and then select Switch > Delete.
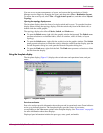
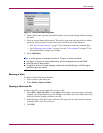
Displaying fabric information
The topology display is the primary tool for monitoring a fabric. The graphic window of the
topology display provides status information for switches and the Ethernet connection to the
management workstation.
The data window tabs show name server, switch, and active zone set information. The Active
Zoneset tab shows the zone definitions for the active zone set. See “Name Server data
window” on page 63 and “Switch data window” on page 63 for information about the Name
Server and Switch data windows.
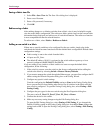
Fabric status
The fabric updates the topology and faceplate displays by forwarding changes in status to the
management workstation as they occur. You can allow the fabric to update the display status,
or you can refresh the display at any time.
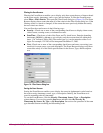
To refresh the topology display, do one of the following:
■ Click Refresh.
■ Select View > Refresh.
■ Press F5.
■ Right-click anywhere in the background of the topology display, and then click Refresh
Fabric from the menu.
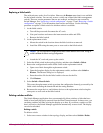
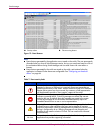
The topology display uses switch and status icons to provide status information about switches
and the Ethernet connection. The switch status icons, displayed on the left side of a switch,
vary in shape and color. Switches controlled by an Ethernet Internet Protocol have a colored
Ethernet icon displayed on the right side of the switch. A green Ethernet icon indicates normal
operation, yellow indicates a condition that may require attention to maintain maximum
performance, and red indicates a potential failure. Table 6 shows the different switch icons and
their meanings.