Switch Manager
91HP StorageWorks 2/8q Fibre Channel Switch Management User Guide
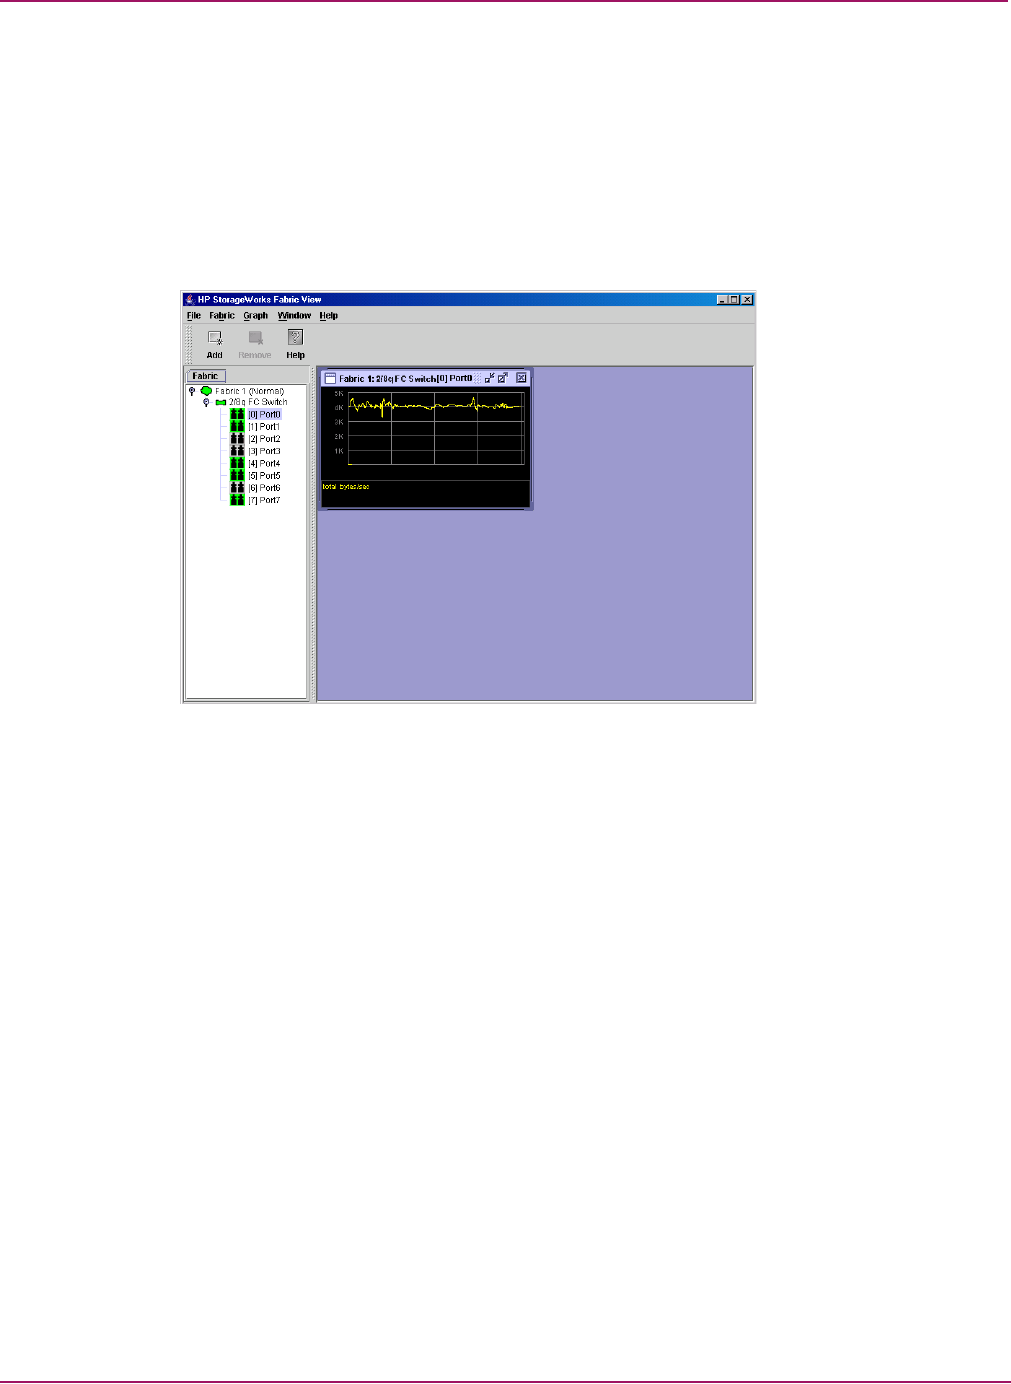
Graphing port performance
The HP StorageWorks Fabric View application displays port performance using graphs. HP
StorageWorks Fabric View plots data communication rates and total errors for selected ports
as shown in Figure 34. When graphing data communication rates, you can choose either
frames/second or KB/second.
Fabric status is displayed in text format after the fabric name in the fabric tree. The color of the
icon indicates the current connection status as normal (green), warning (yellow), critical (red),
or unmanageable (blue).
Figure 34: Fabric View graphs
This section describes the following:
■ Starting HP StorageWorks Fabric View, page 91
■ Exiting HP StorageWorks Fabric View, page 92
■ Saving and opening Fabric View files, page 92
■ Changing the Default Fabric View File encryption key, page 93
■ Setting HP StorageWorks Fabric View preferences, page 93
■ Setting the polling frequency, page 93
■ Displaying graphs, page 94
■ Arranging graphs in the display, page 94
■ Customizing graphs, page 94
■ Printing graphs, page 96
■ Rescaling a selected graph, page 96
■ Saving graph statistics to a file, page 96
Starting HP StorageWorks Fabric View
To start HP StorageWorks Fabric View from within Switch Manager, open the topology
display and then select Fabric > Start Fabric View.


