


•
•
•
•
•
•
•
•
•
•
•
•
•
•
•
•
•
•
•
•
•
•
•
•
•
•
•
•
•
•
•
•
•
•
•
•
•
•
•
•
•
•
•
•
•
•
•
•
•
•
•
•
•
•
•
•
•
•
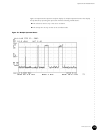
RF Measurements
Upstream RF Measurement
139
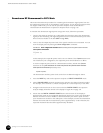
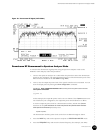
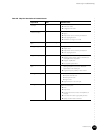
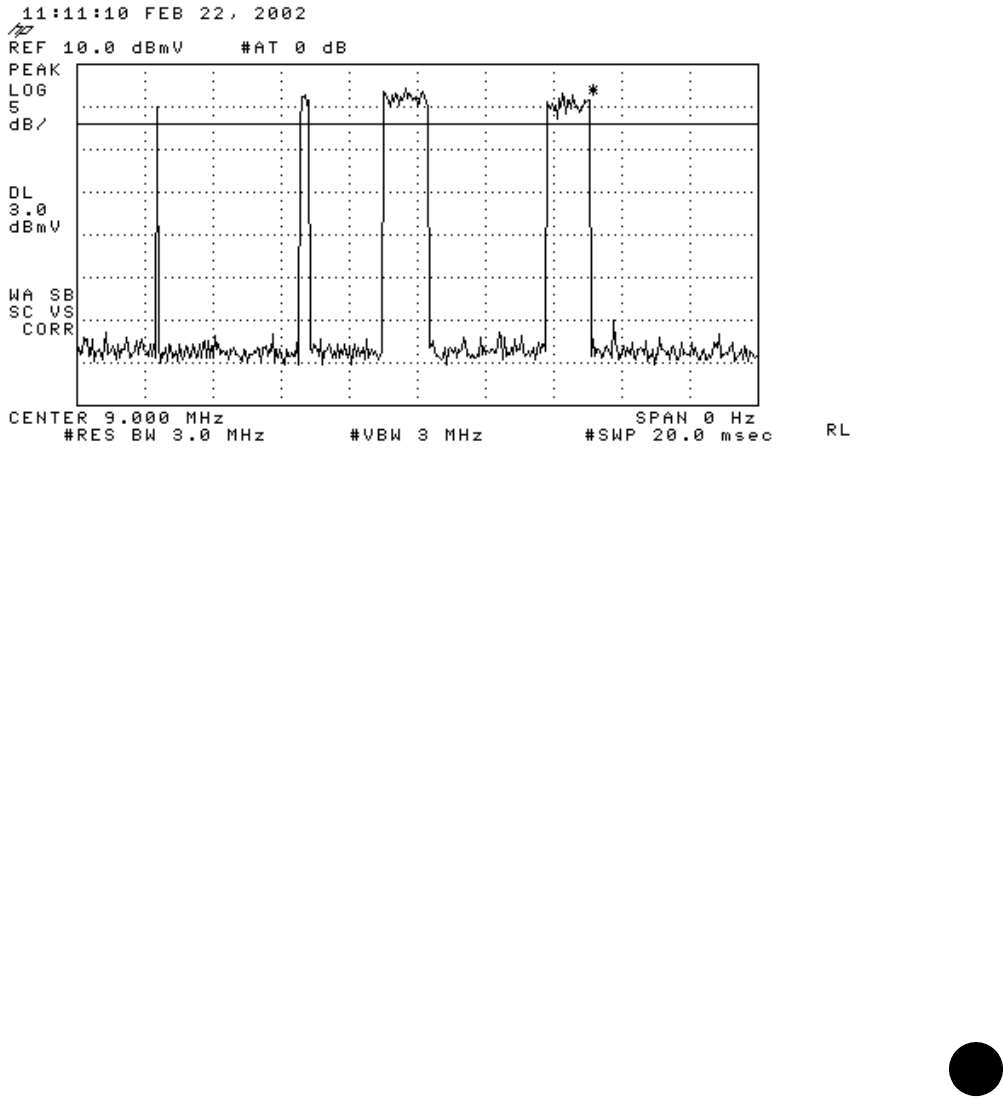
Figure 43 represents the spectrum analyzer display of multiple upstream bursts. This display
was produced by repeating this procedure with the following modifications:
! The reference level in step 7 was set to 10 dBmV.
! The sweep time in step 10 was set to 20 milliseconds.
Figure 43: Multiple Upstream Bursts