


Section 5 User Interface Guide TRACER 6000 Series Integrated System Manual
66 Copyright © 2005 ADTRAN, Inc. 612806420L1-1F
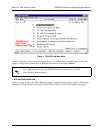
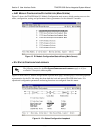
> RF LINK ERROR HISTORY
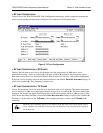
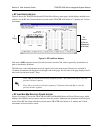
Figure 9 shows the TRACER 64x0 main RF Link Error History menu page, which displays detailed error
statistics for the RF link (from both the local and remote TRACER 64x0 units) in 15-minute and 24-hour
increments.
Figure 9. RF Link Error History
Link errors (LNK) represent errored seconds across the wireless link, and are generally an indication of
path or interference problems.
The link error count and minimum received signal level for the most recent 24 hours are recorded in
15-minute increments and displayed on the right side of the page. The left side of the page displays the 24
hour totals for the most recent 7 days.
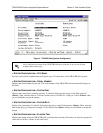
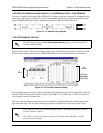
> RF LINK MAX/MIN RECEIVED POWER HISTORY
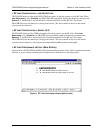
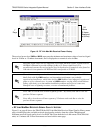
Figure 10 on page 67 shows the TRACER 64x0 RF Link Max/Min Received Power History page, which
displays the available received power statistics from the system. Minimum and maximum received signal
levels for the RF link (from both the local and remote TRACER 64x0 units) in 15-minute and 24-hour
increments are found on this screen.
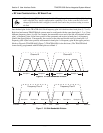
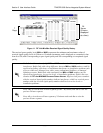
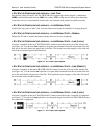
Press <u> to view the next 24-hour segment (for the 7 day totals) and <d> to view the
previous 24-hour segment.
Press <f> to view the next 8-hour segment of 15-minute totals and <b> to view the
previous 8-hour segment.
7
Days
24
Hours
(8 hours
displayed
at a time)