


MCF52211 ColdFire® Integrated Microcontroller Reference Manual, Rev. 2
Freescale Semiconductor 28-1
Chapter 28
Debug Module
28.1 Introduction
This chapter describes the revision B+ enhanced hardware debug module.
28.1.1 Block Diagram
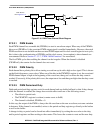
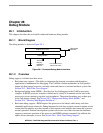
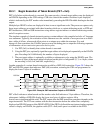
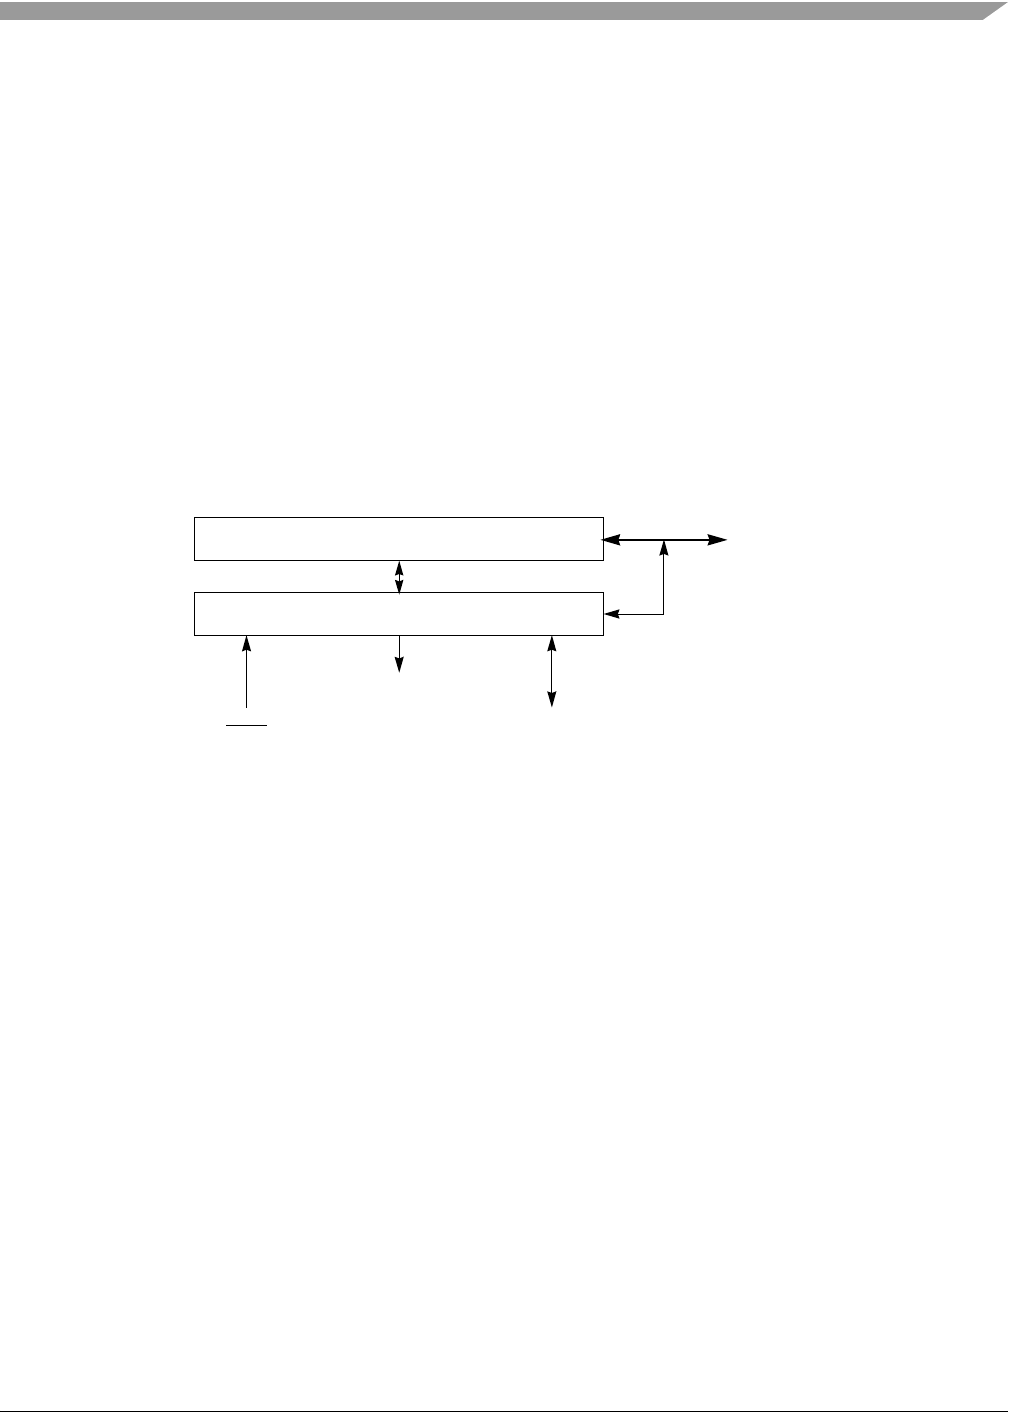
The debug module is shown in Figure 28-1.
Figure 28-1. Processor/Debug Module Interface
28.1.2 Overview
Debug support is divided into three areas:
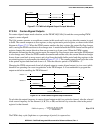
• Real-time trace support—The ability to determine the dynamic execution path through an
application is fundamental for debugging. The ColdFire solution implements an 8-bit parallel
output bus that reports processor execution status and data to an external emulator system. See
Section 28.3, “Real-Time Trace Support”.
• Background debug mode (BDM)—Provides low-level debugging in the ColdFire processor
complex. In BDM, processor complex is halted and a variety of commands can be sent to the
processor to access memory, registers, and peripherals. The external emulator uses a three-pin,
serial, full-duplex channel. See Section 28.5, “Background Debug Mode (BDM),” and
Section 28.4, “Memory Map/Register Definition”.
• Real-time debug support—BDM requires the processor to be halted, which many real-time
embedded applications cannot do. Debug interrupts let real-time systems execute a unique service
routine that can quickly save the contents of key registers and variables and return the system to
normal operation. External development systems can access saved data, because the hardware
supports concurrent operation of the processor and BDM-initiated commands. In addition, the
option allows interrupts to occur. See Section 28.6, “Real-Time Debug Support”.
ColdFire CPU Core
Debug Module
High-speed
Communication Port
DSCLK, DSI, DSO
Control
BKPT
local bus
Trace Por t
PST[3:0],
DDATA[3:0]
PSTCLK