


310
CHAPTER 2 DEPENDENCE FUNCTIONS
2.6.9 Viewing Program Execution History [Trace]
This section describes the trace function of this emulator debugger.
■ What is Trace
The function that records the program execution history is called "trace".
Trace data contains address information before and after branch, which is available for the analysis of the
program execution history.
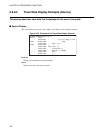
■ Trace Functions
This emulator debugger has the following trace functions.
• Forced start: Forcibly starts acquiring trace data without stopping the execution of a user program
while forced stop is executed and trace data acquisition is stopped.
• Forced stop: Forcibly ends acquiring trace data without stopping the execution of a user program
during acquisition of trace data.
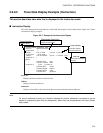
■ Acquiring Trace Data
The trace data acquisition is started and ended at the following times.
● The acquisition is started when:
- a user program has been executed; or
- the [Start] menu has been selected when a user program has been executed.
● The acquisition is ended when:
- a user program has been stopped; or
- the [Abort] menu has been selected during trace data acquisition.
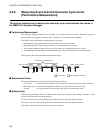
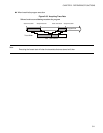
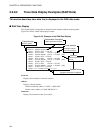
■ Trace Buffer
A place to store recorded data is called a "trace buffer".
Each unit of data stored in the trace buffer is called a "frame".
The trace buffer can contain up to 1,024 frames.
The trace buffer has a ring-like structure. If the trace buffer becomes full, it is automatically overwritten from
the beginning.
Figure 2.6-5 shows how data is stored in the trace buffer.