


52
CHAPTER 2 DEPENDENCE FUNCTIONS
2.1.11 Trace
The address and status information can be sampled during program execution to record
it in a trace buffer. This function is called a trace.
■ Trace
The address and status information can be sampled during program execution to record it in a trace buffer.
This function is called a trace. Data of the trace buffer can be used to make a detailed analysis of a program
execution history.
The trace buffer is in the form of a ring. When it becomes full, it records the next data by automatically
overwriting the buffered data at the beginning.
■ Trace Data
The simulator debugger can sample 1000 frames of trace data for the address of the executed instruction.
■ Abortion of Trace Measurement
While the trace function is enabled, data is always sampled and recorded in the trace buffer during execution
of a user program.
The program execution aborts due to a break factor such as a breakpoint, terminating the trace.
Furthermore, when the trace buffer becomes full, a program break can be invoked. This break is called a
trace buffer full break.
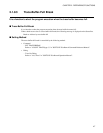
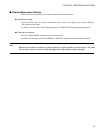
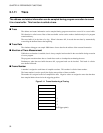
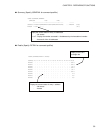
■ Frame Number
A number is assigned to each frame of sampled trace data. This number is called a frame number.
The frame number is used to specify the display start position of the trace buffer.
The number 0 is assigned to the last-sampled trace data. Negative values are assigned to trace data that have
been sampled before the arrival at the triggering position.
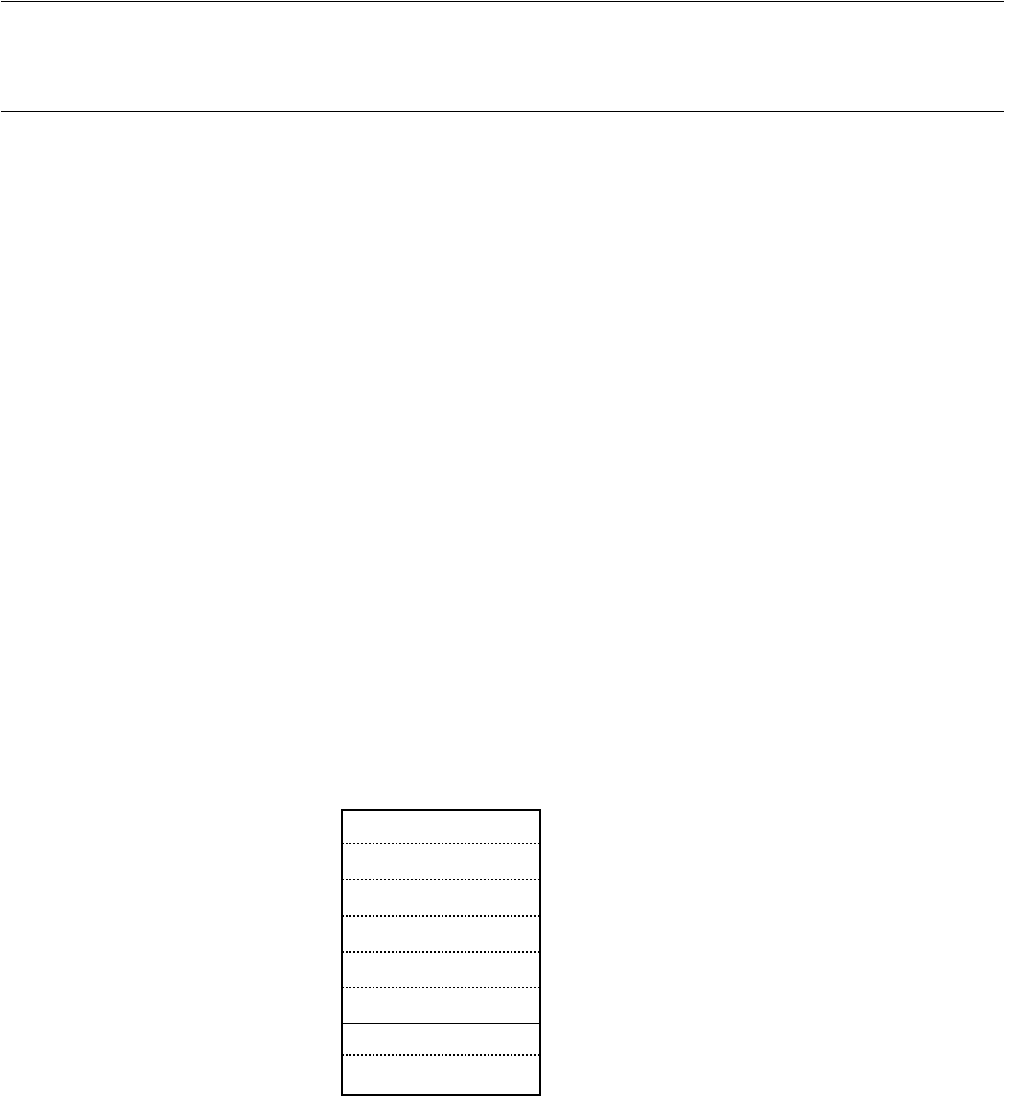
Figure 2.1-1 Frame Numbering at Tracing
.
.
.
.
-3
-2
-1
0 (Trigger point)