94 An introduction to HP apps
Trig
Trig
Trace
[Scope: Advanced Graphing, Function, Parametric, Polar,
Sequence, Solve, Statistics 1 Var, and Statistics 2Var.]
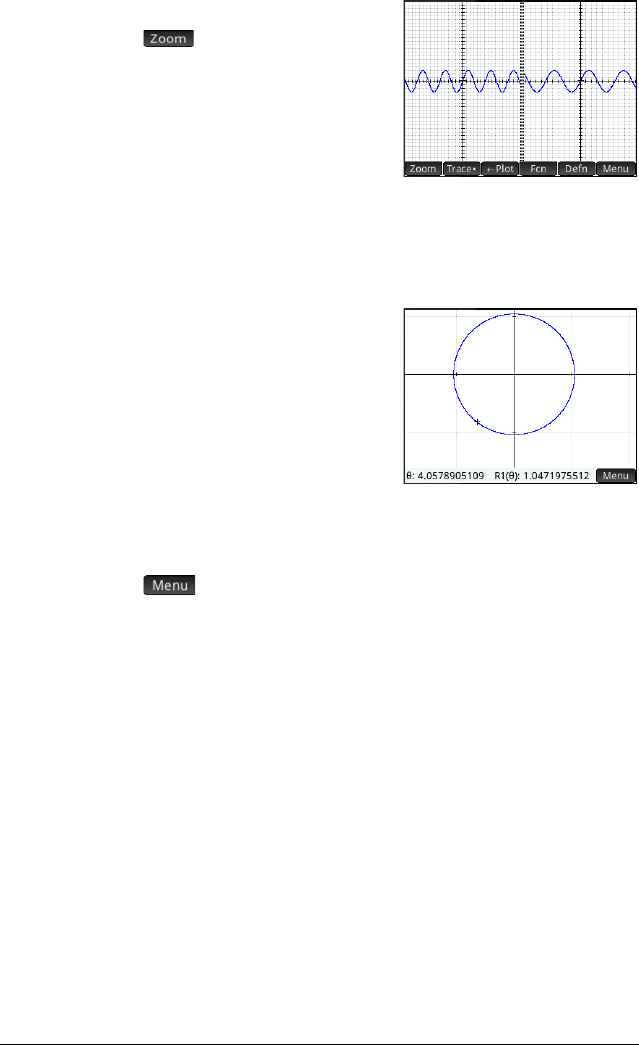
The tracing functionality enables
you to move a cursor (the trace
cursor) along the current graph.
You move the trace cursor by
pressing
<
or
>
. You can also
move the trace cursor by tapping
on or near the current plot. The
trace cursor jumps to the point
on the plot that is closest point to where you tapped.
The current coordinates of the cursor are shown at the bottom of
the screen. (If menu buttons are hiding the coordinates, tap
to hide the buttons.)
Trace mode and coordinate display are automatically turned on
when a plot is drawn.
To select a
plot
Except in the Advanced Graphing app, if there is more than one
plot displayed, press
=
or
\
until the trace cursor is on the plot
you are interested in.
In the Advanced Graphing app, tap-and-hold on the plot you are
interested in. Either the plot is selected, or a menu of plots
appears for you select one.
To evaluate a
definition
One of the primary uses of the trace functionality is to evaluate a
plotted definition. Suppose in Symbolic view you have defined
F1(X) as (X–1)
2
–3. Suppose further that you want to know
what the value of that function is when X is 25.
1. Open Plot view (
P).
