In addition to the text which describes the status, these fields are displayed with colored icons. The icon
color depicts that status as follows:
• Red - Major and Critical problems
• Magenta – Minor problems
• Yellow - Unknown, Stale, Suspect, and Warning problems
• Green - Normal, no problem
Click on the button to the right of the status icon to get more details.
For Servers, Devices and Drives, and Storage Class Thresholds the button will open the corresponding
SSM list window in sick list mode. Once this window is open, use it to get detailed status information on
the sick entries, assuming the HPSS Servers are still healthy enough to respond to SSM requests.
See Section 3.10: SSM List Preferences on page 69 for more information on the sick list mode.
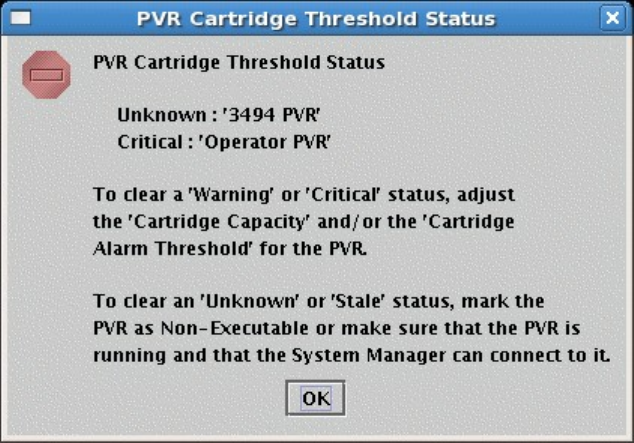
For PVR Cartridge Thresholds the button will display a message dialog with information about the PVRs
that have cartridge threshold issues. This message dialog will look like the following;
The status section of the HPSS Health and Status window can be hidden from view by selecting the
View menu item and unchecking the HPSS Status checkbox.
3.9.3.3. HPSS Statistics
The HPSS Statistics fields are located in the middle section of the HPSS Health and Status window and
display the number of bytes moved, bytes used, data transfers, and current PVL jobs in the system. The
number of bytes moved and number of data transfers indicate the data accumulated by the Movers since
startup or data reset.
HPSS Management Guide November 2009
Release 7.3 (Revision 1.0) 61


