


11-1
v1.0, January 2010
Chapter 11
Monitoring System Access and Performance
This chapter describes the system monitoring features of the UTM. You can be alerted to important
events such as a WAN port rollover, WAN traffic limits reached, login failures, and attacks. You
can also view status information about the firewall, WAN ports, LAN ports, active VPN users and
tunnels, and more. In addition, the diagnostics utilities are described.
This chapter contains the following sections:
• “Enabling the WAN Traffic Meter” on this page.
• “Configuring Logging, Alerts, and Event Notifications” on page 11-5.
• “Monitoring Real-Time Traffic, Security, and Statistics” on page 11-14.
• “Viewing Status Screens” on page 11-20.
• “Querying Logs and Generating Reports” on page 11-32.
• “Using Diagnostics Utilities” on page 11-43.
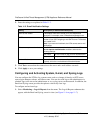
Enabling the WAN Traffic Meter
If your ISP charges by traffic volume over a given period of time, or if you want to study traffic
types over a period of time, you can activate the traffic meter for one or both WAN ports.
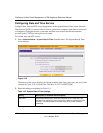
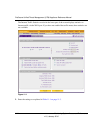
To monitor traffic limits on each of the WAN ports:
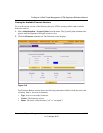
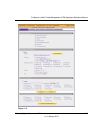
1. Select Network Config > WAN Metering from the menu. On the dual-WAN port models, the
WAN Metering tabs appear, with the WAN1 Traffic Meter screen in view (see Figure 11-1 on
page 11-2). On the the single-WAN port models, the WAN Traffic Meter screen displays.
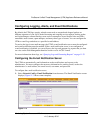
Note: All log and report functions that are part of the Logs & Reports configuration
menu and some of the functions that are part of the Diagnostics configuration
menu require that you configure the e-mail notification server—see “Configuring
the E-mail Notification Server” on page 11-5.