ProSecure Unified Threat Management (UTM) Appliance Reference Manual
11-20 Monitoring System Access and Performance
v1.0, January 2010
Viewing Status Screens
The UTM provides real-time information in a variety of status screens that are described in the
following sections:
• “Viewing System Status” on this page.
• “Viewing Active VPN Users” on page 11-24.
• “Viewing VPN Tunnel Connection Status” on page 11-24.
• “Viewing Port Triggering Status” on page 11-26.
• “Viewing the WAN Ports Status” on page 11-27.
• “Viewing Attached Devices and the DHCP Log” on page 11-29.
• “Viewing the DHCP Log” on page 11-31.
Viewing System Status
The System Status screen provides real-time information about the following important
components of the UTM:
• CPU, memory, and hard disk status, and the number of active connections per protocol.
• Firmware versions and update information of the UTM, software versions and update
information of the components, license expiration dates for each type of license, and hardware
serial number.
• WAN and LAN port information.
• Interface statistics.
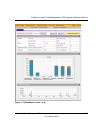
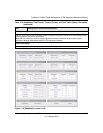
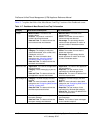
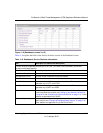
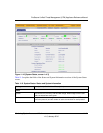
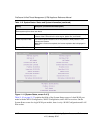
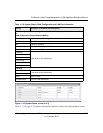
To view the System Status screen, click Monitoring > System Status. Because of the size of the
System Status screen, it is divided and presented in this manual in three figures (Figure 11-10 on
page 11-21, Figure 11-11 on page 11-22, and Figure 11-12 on page 11-23, all of which show
examples for the dual-WAN port models), each with its own table that explains the fields. For the
dual-WAN port models, the System Status screen shows information for both the WAN1 and
WAN2 port. For the single-WAN port models, the System Status screen shows information for the
single WAN port.


