ProSecure Unified Threat Management (UTM) Appliance Reference Manual
Monitoring System Access and Performance 11-43
v1.0, January 2010
4. Click Apply to save your settings.
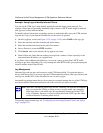
Using Diagnostics Utilities
The UTM provides diagnostic tools that help you analyze traffic conditions and the status of the
network. Two sets of tools are available:
• Network diagnostic tools. These tools include a ping utility, traceroute utility, and DNS
lookup utility, and the option to display the routing table.
• Traffic diagnostic tools. These tools allow you to perform real-time, per-protocol traffic
analysis between specific source and destination addresses and let you generate reports on
network usage in your network.
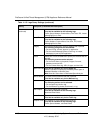
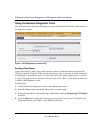
To display the Diagnostics screen, select Monitoring > Diagnostics from the menu. To facilitate
the explanation of the tools, the Diagnostics screen is divided and presented in this manual in three
figures (Figure 11-26 on page 11-44, Figure 11-27 on page 11-46, and Figure 11-28 on page
11-47).
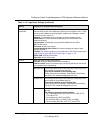
Reports Select one or more checkboxes to specify the reports that are generated:
• Email Reports.
• Web Reports.
• System Reports.
Note: You can select all three checkboxes, but you might generate a very large
report.
Send Report by
Email
Select this checkbox to enable the UTM to send the report to the recipients that
you must specify below.
Recipients The e-mail addresses of the report recipients.
Note: Use commas to separate email addresses.
Report List
Number of
Reports to Keep
Enter the number of reports that the UTM saves. The maximum number is 12.
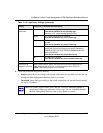
Note: For normal operation, diagnostic tools are not required.
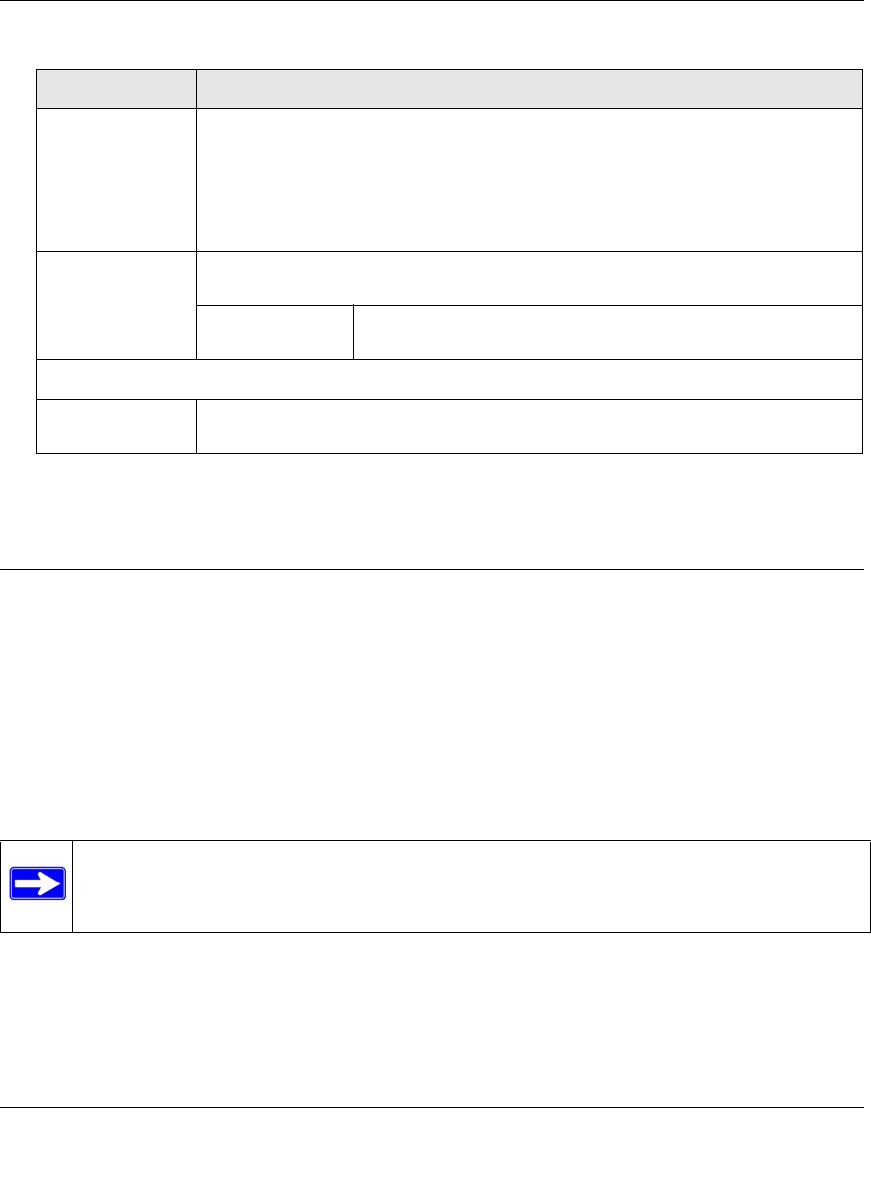
Table 11-17. Schedule Report Settings (continued)
Setting Description (or Subfield and Description)


