


6 – Managing Ports
Displaying Port Information
6-4 59048-02 A
Q
6.1.1.4
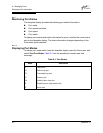
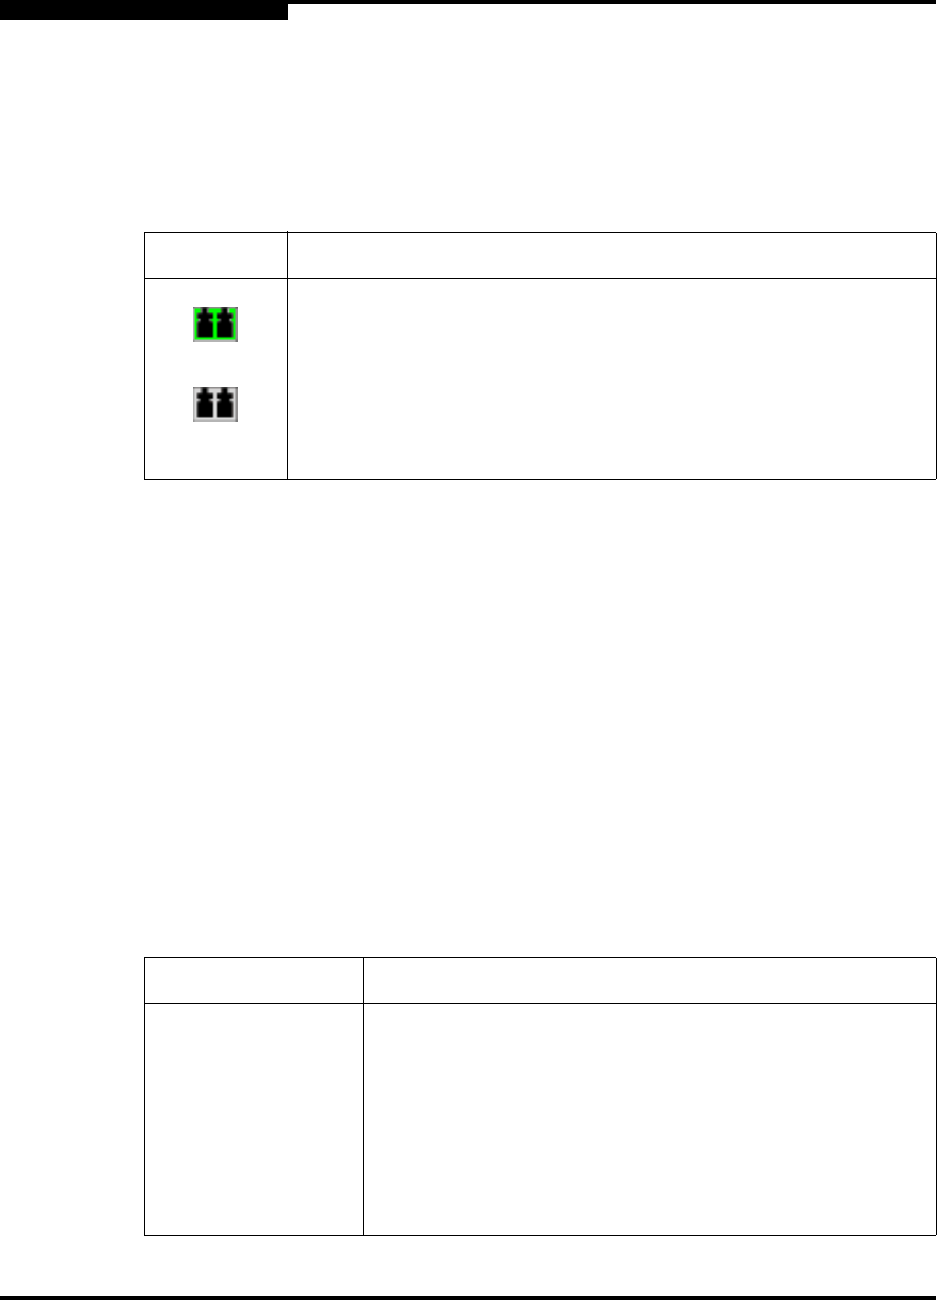
Displaying Transceiver Media Status
To display transceiver media status, open the View menu and select View Port
Media. Table 6-2 lists the possible media states and their meanings.
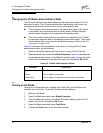
6.1.2
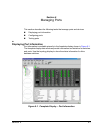
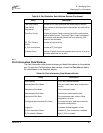
Port Statistics Data Window
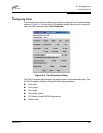
The Port Statistics data window displays statistics about port performance. To
open the Port Statistics window, select one or more ports in the faceplate display
and choose the Port Stats tab below the data window. Table 6-5 describes the
Port Statistics data window entries.
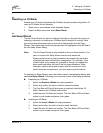
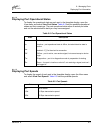
The Statistics pull-down menu is available on the Port Statistics data window, and
provides different ways to view detailed port information. Choose the down arrow
to open the pull-down menu. Open the pull-down menu and select Absolute to
view the total count of statistics since the last switch reset. Select Rate to view the
number of statistics counted per second over the polling period. Select Baseline
to view the total count of statistics since the last time the baseline was set. When
viewing baseline statistics, choose the Clear Baseline button to set the current
baseline.
Table 6-4. Transceiver Media View
Media Icon Description
Optical SFP, Online (Green)
Optical SFP, Offline (Gray)
None Empty port, no transceiver installed
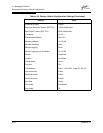
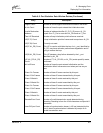
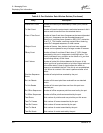
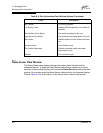
Table 6-5. Port Statistics Data Window Entries
Entry Description
Start Time The beginning of the period over which the statistics apply. The
start time for the Absolute view is not applicable. The start time
for the Rate view is the beginning of polling interval. The start
time for the Baseline view is the last time the baseline was set.
End Time The last time the statistics were updated on the display.
Total Time Total time period from start time to end time.
Login Count Number of device logins that have occurred on the switch.