


2 – Using SANbox Manager
Using the Topology Display
59048-02 A 2-19
Q
2.11
Using the Topology Display
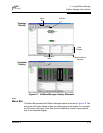
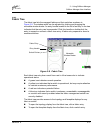
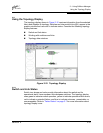
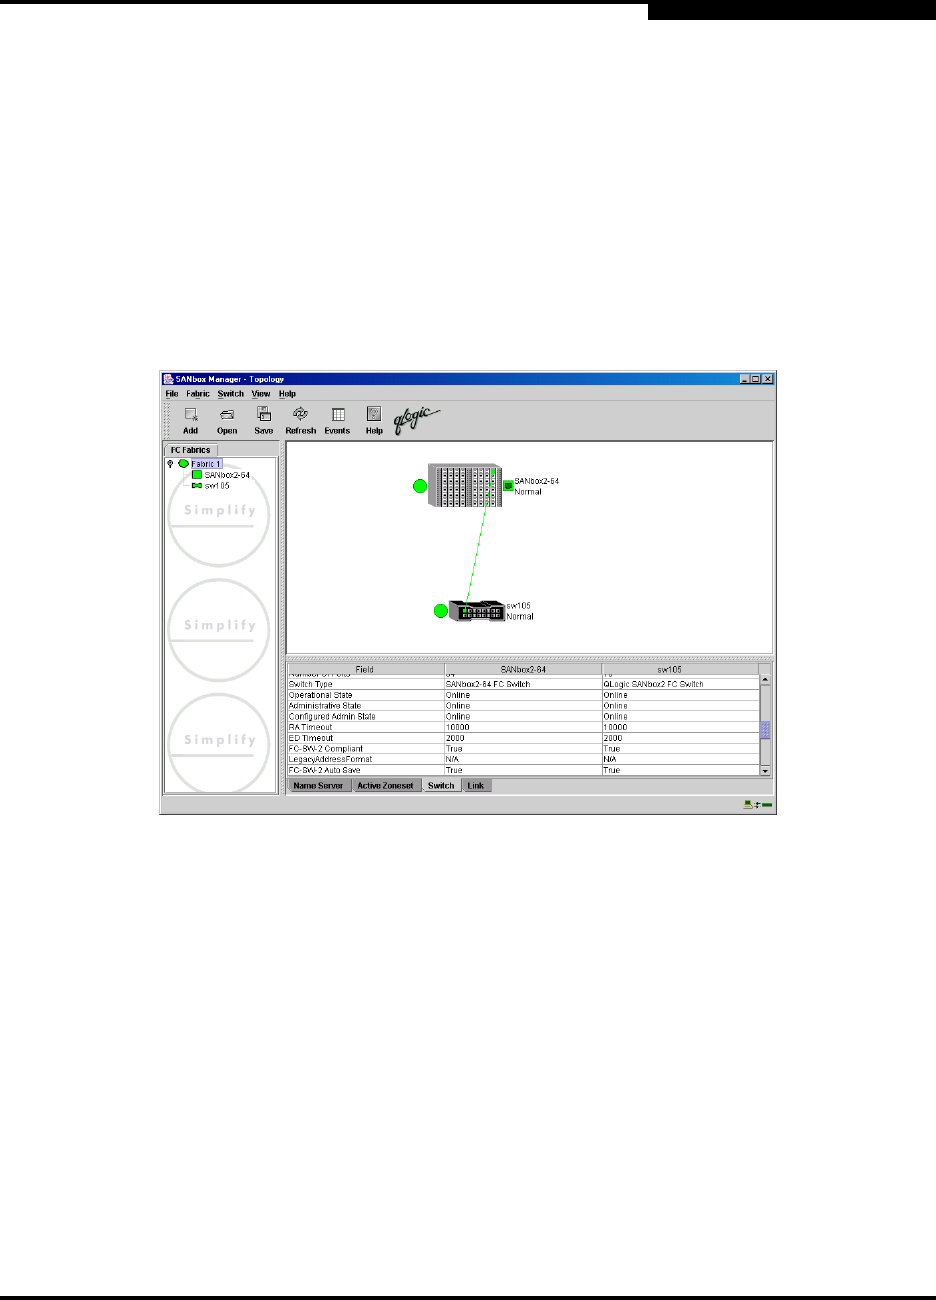
The topology display shown in Figure 2-10 receives information from the selected
fabric and displays its topology. Switches and inter-switch links (ISL) appear in the
graphic window and use color to indicate status. Consider the following topology
display features:
Switch and link status
Working with switches and links
Topology data windows
Figure 2-10. Topology Display
2.11.1
Switch and Link Status
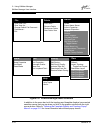
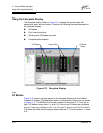
Switch icon shape and color provide information about the switch and its
operational state. Lines represent links between switches. The topology display
uses green to indicate normal operation, yellow to indicate operational with errors,
red to indicate a potential failure, and blue to indicate unknown, unreachable, or
unmanageable. Refer to ”Fabric Status” on page 3-7 for more information about
topology display icons.