


2 – Using SANbox Manager
SANbox Manager User Interface
2-18 59048-02 A
Q
2.10.4
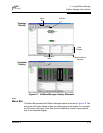
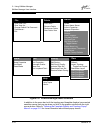
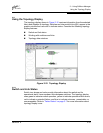
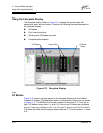
Graphic Window
The graphic window presents graphic information about fabrics and switches such
as the fabric topology and the switch faceplate. The window length can be
adjusted by clicking and dragging the window border that it shares with the data
window.
2.10.5
Data Window and Tabs
The data window presents a table of data and statistics associated with the
selected tab. Use the scroll bar to browse through the data. The window length
can be adjusted by clicking and dragging the border that it shares with the graphic
window.
Adjust the column width by moving the pointer over the column heading border
shared by two columns until a right/left arrow graphic is displayed. Click and drag
the arrow to the desired width.
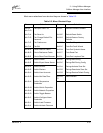
The data window tabs present options for the type of information to display in the
data window. These options vary depending on the display.
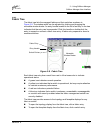
2.10.6
Working Status Indicator
The working status indicator, located in the lower right corner of SANbox Manager
window, shows when the management workstation is exchanging information with
the fabric. As conditions change, the fabric forwards this information to the
management workstation where it is reflected in the various displays.